Authors: Nic Carter (Castle Island Ventures) , Ross Stevens (NYDIG) | Link
Executive summary
Since 1920, at least 55 hyperinflation events have taken place, destroying savings and creating economic hardship. Such events generally result from the mismanagement of financial systems and the economy by central governments. Bitcoin offers the world an alternative – a sound monetary system outside the control of governments and central banks.
Particularly for the billions of people in less fortunate economic circumstances, Bitcoin represents a major breakthrough. It offers workers and savers a means to protect themselves from inflation by storing their wealth in a medium that is independent of central banks and resistant to government expropriation. Bitcoin has been adopted by over 100 million individuals worldwide over its short lifetime, with elevated adoption in countries with high inflation, onerous capital controls, a weak respect for property rights, or poor governance. People in these countries value Bitcoin’s institutional qualities, which compare favorably with their local settings.
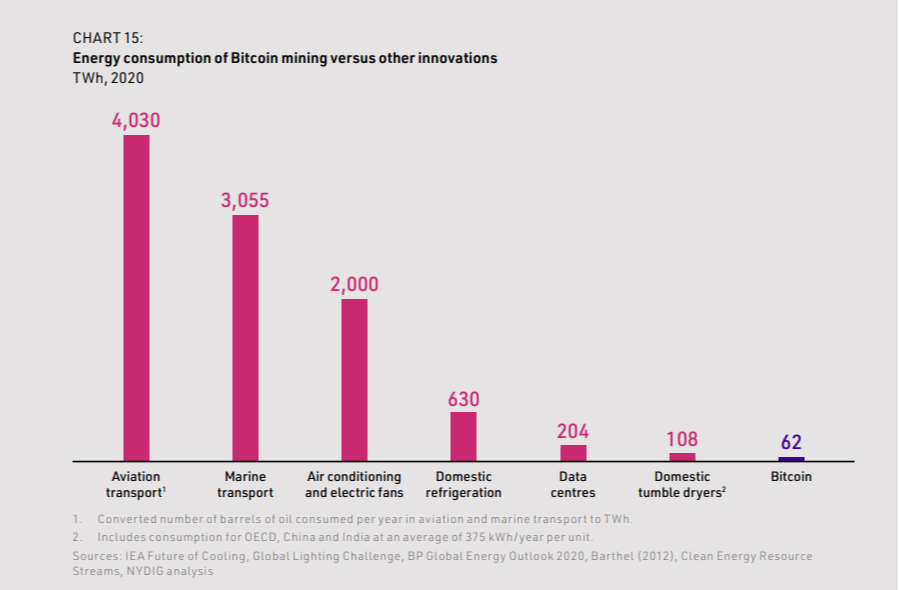
To serve its role, Bitcoin relies upon a ‘proof of work’ system, through which miners compete to assemble transactions in a shared global ledger. This process is the primary driver of Bitcoin’s energy costs and associated carbon emissions, which can be considered in the context of the energy costs of other technologies that have improved our quality of life, such as heating, air conditioning, washing machines, and tumble dryers. We estimate that Bitcoin consumed 62 TWh of electricity in 2020, which resulted in 33 million tonnes of carbon dioxide emissions, insignificant in global terms, representing just 0.04 percent of global primary energy consumption and 0.1 percent of global carbon emissions. Bitcoin’s electricity consumption is also low compared to other energy-intensive modern conveniences, such as domestic refrigeration (630 TWh) and domestic tumble dryers (108 TWh).
If demand for Bitcoin continues to increase, its price will continue to rise, encouraging Bitcoin miners to expend more energy to complete blocks – because they are rewarded in bitcoin. Counteracting this incentive to mine is the preordained halving of Bitcoin rewards approximately every four years, which reduces mining revenue and the consequent demand for electricity.
We have assessed the future carbon footprint of Bitcoin using a number of future price scenarios. In a base case, the price of Bitcoin reaches $60,000 by 2030. Electricity consumption and associated emissions peak at around 120 TWh and 47 MtCO2 in 2024, before declining rapidly. By 2028, emissions are below a net-zero pathway (a linear reduction in carbon emissions from 2020 levels to zero by 2050).
In a high price scenario, Bitcoin reaches $490,000 by 2030, or 45 times its average 2020 price. Electricity consumption peaks in 2027 at 11 times its 2020 level, and associated carbon emissions are seven times their 2020 level. Emissions fall rapidly after 2027, reaching 22 MtCO2 by 2040. Even at the peak of the high price scenario, Bitcoin’s emissions only account for 0.9 percent of global carbon emissions.
By providing a sound new monetary system, independent of government, Bitcoin can provide value to billions of people. This far outweighs its associated energy requirements. Moreover, many miners are increasingly focused on minimizing the carbon emissions associated with their activities by purchasing offsets, procuring renewable energy, favoring locations with renewable energy, and using otherwise wasted energy, such as curtailed hydro power and flared gas. Over the longer term, the intensity of Bitcoin’s carbon emissions (and with it Bitcoin’s absolute carbon emissions) will decline, as the development of renewables continues and countries strive to decarbonize their electricity grids.
Section 1: Significance of Bitcoin today
This section introduces and considers Bitcoin in its context as a non-sovereign monetary system rapidly penetrating a world of fiat currencies. It encourages readers to consider the human cost of monetary instability borne by billions of individuals worldwide. Having access to a stable currency in a country that respects property rights is the exception rather than the norm. We consider the following questions:
- What are the costs and drawbacks associated with monetary instability?
- What place does Bitcoin have among monetary assets today?
- How much has Bitcoin been adopted in its first 12 years?
- Where has Bitcoin been most heavily adopted, and what does this tell us about its value proposition?
- What is the relationship between energy consumption and quality of life?
Summary
- Numerous examples can be found where currency collapse has caused immediate and demonstrable harm to citizens. We profile the recent examples of Argentina, Lebanon, Turkey, Cuba, and Nigeria.
- So far in history, 56 hyperinflation events have taken place. All but one took place in the 20th or 21st century, and none occurred in an economy with a currency based on a commodity standard. The savings of people who did not exchange the currency for hard assets were destroyed.
- Currency crises disproportionately affect the middle and lower classes, who do not own real assets and do not have the means to be sufficiently nimble and move assets abroad.
- Bitcoin can benefit citizens by forcing central banks that might have been overly inflationary to adopt monetary discipline.
- Bitcoin offers savers a means to store their wealth in a medium that is independent of central banks. Over 100 million individuals worldwide have adopted it over its short lifetime.
- High per-capita adoption of Bitcoin is evident in countries with elevated inflation, onerous capital controls, a weak respect for property rights, and poor governance. This demonstrates that individuals in these countries value Bitcoin’s institutional qualities, which compare favorably with their local settings.
- Bitcoin’s energy costs must be considered in the context of its merits. Numerous energy-consuming technologies – for example, heating, air conditioning, washing machines, and tumble dryers – have been embraced because they improve quality of life.
1.1 The human cost of monetary instability
Argentina, December 2001
On December 1, 2001, all bank accounts in Argentina were frozen. The Argentine peso depreciated 40 percent overnight against the US dollar and lost 75 percent of its value over the following three years. Most of the savers who watched as the value of their frozen savings declined were smaller depositors; those with means had offshored their funds to safer jurisdictions in the time leading up to the overnight devaluation.
The savings of the middle and lower classes were virtually destroyed. With money frozen, commerce collapsed, and unemployment spiked, peaking at 22.5 percent. Riots resulted in 24 deaths in December alone. Seven million middle-class people were cast into poverty because of what became known as the corralito – literally ‘playpen’ – and its aftermath. This meant that 18 percent of the population became nuevos pobres – newly poor.
Devaluations generally occur suddenly, invariably violate property rights, and inflict maximum pain on the least economically mobile. The banking system – out of which deposits become cumbersome or impossible to extract – is generally the primary means of expropriation. Argentina’s corralito tragically followed the devaluation textbook.
With this and other memories of sharp devaluations looming large in living memory, Argentina has one of the world’s highest per-capita rates of cryptocurrency adoption. The Argentine crypto brokerage Ripio boasts 1.3 million users, attracted by sound, non-state money such as Bitcoin.
Turkey, May 2018
On May 23, 2018, the Turkish lira fell five percent against the US dollar. The catalyst: President Erdogan’s announcement that he would override the views of the central bank and take control of interest rates directly. The lira depreciated by 25 percent over the year, and it has fallen 77 percent against the dollar since 2013. Official inflation has run well above 10 percent for the last three years, disproportionately hurting low-income households that lack previously owned hard assets to barter and sell. Inflation has spiked, and growth has plummeted.
Given the cultural affinity for gold in Turkey, it’s no surprise that Bitcoin has played a significant role as the currency has weakened. Turkey boasts the world’s eighth highest per-capita cryptocurrency penetration, with an estimated 5 million crypto investors. Local exchanges BtcTurk and Paribu count 3 million users apiece.
Turkey’s 84 million inhabitants have been forced to reckon with a currency crisis exacerbated by the direct imposition of President Erdogan’s views on monetary policy, combined with a weak, non-independent central bank that has a revolving door of governors. The current crisis, caused by unsustainable government borrowing and spending, combined with a lack of monetary credibility, has wreaked havoc on the population.
Lebanon, October 2019
In October 2019, Lebanese banks imposed arbitrary withdrawal limits, trapping user savings in a system that could not meet its outstanding liabilities. ATMs ceased dispensing cash. Since fall 2019, the Lebanese pound has depreciated 91 percent against the US dollar. Even though the pound remains nominally pegged at 1,500 to $1, the street rate is 17,000 to $1. Amidst the chaos, large depositors have extricated themselves from the banking system, smuggling $6 billion out of the country, in direct circumvention of capital controls. The meager life savings of smaller depositors have been frozen.
The consequences of the financial crisis and currency collapse have been dire. The once vibrant middle class has been obliterated. Ordinary citizens, unable to access functional financial services, have resorted to bartering goods. Over half of the population has been driven into poverty. The World Bank has labeled the episode among the world’s 10 worst financial crises since the mid-19th century. Over three-quarters of families cannot eat adequately, and two-thirds of the population now buys food on credit.
As with the Argentine corralito, when a fragile fiat currency breaks, elites often have the means to escape, while small and medium-sized depositors are punished financially and suffer an accelerating decline in living conditions. Faced with a dysfunctional financial system, some entrepreneurial Lebanese have begun to utilize Bitcoin as a bridge currency for remittance purposes.
Cuba, January 2021
Since 1993, Cubans have been forced to juggle competing currencies in a byzantine system of multiple exchange rates. While both the peso and the convertible peso (CUC) are officially pegged to $1, the peso trades at around 4 cents to the dollar. Government workers receive their salaries in pesos, making it the more commonly used currency; convertible pesos are reserved for tourists and imports. The association of the CUC with the ‘luxury’ or tourist sector means that many Cubans have left their peso-remunerated jobs for jobs in tourism or as taxi drivers that give them access to scarcer, more-reliable CUCs. Juggling multiple currencies causes friction and constant confusion; and access to these distinct currencies drives inequality in Cuban society.
The COVID-19 pandemic reduced tourism, significantly hurting the Cuban economy and kicking off an economic crisis. In addition, the government unified the coexisting currency systems on January 1, 2021, sparking a shock devaluation and triple-digit inflation. As with all sharp changes of direction in monetary policy, the effects have been disparate. Cubans who save in domestic pesos and do not work for the government suffered especially from the devaluation, while state workers received an automatic pay rise to offset the inflation.
The devaluation combined with a shortage of dollars to intensify an economic crisis. Inflation will be at least 500 percent this year, and Cubans have been forced to acquire currency on the black market in order to obtain everyday food and commodities. The crisis sparked the most intense protests against the Cuban regime since the revolution in 1959. The economic misery is so pronounced that Cubans are risking arrest by the secret police by engaging in the nation’s first ever mass protests.
Nigeria, May 2021
Nigeria is Africa’s most populous country with 211 million inhabitants, as well as a growing economic powerhouse likely to play a significant role in the continent’s future. Yet its people have been saddled with an unreliable monetary system. Inflation reached 18 percent in March 2021 with food prices especially unstable. Material inflation is commonplace for Nigerians – since 2008 it has averaged 12.2 percent. The monetary woes worsened this year with the abrupt devaluation of the naira, which resulted from a bid to harmonize the country’s two parallel currencies. Naira-denominated savings ebbed away, and Nigeria also fell into a painful recession. However, savers find it hard to exit the naira for other, sounder, currencies because of rigid currency controls.
That makes it no surprise that Nigeria has a very high rate of Bitcoin adoption – the highest in the world, according to Statista: In a recent survey, 32 percent of respondents claimed to use cryptocurrency. Even government action to cut off exchanges from the banking sector failed to stem enthusiasm for Bitcoin. Users simply migrated to peer-to-peer exchanges, like Paxful, where Nigeria ranks second globally behind the US. Chainalysis estimates that $2.4 billion worth of cryptocurrency flowed into Nigerian hands in May 2021 alone.
Uses for Bitcoin in Nigeria are extremely diverse. Political activist groups, excluded from the formal banking sector, have used Bitcoin to accept donations and mobilize in a way that avoids censors. Some Nigerians are also using Bitcoin as an alternative savings device. Others are using bitcoins as a bridge currency to import US dollars. Bitcoin is also a medium of exchange for exporters hampered by currency controls. In short, Bitcoin is unlocking the creativity and economic potential of a growing and ambitious population, offering them an alternative to an exclusionary and unstable financial system.
These recent examples are, tragically, only a small sample of the world’s monetary collapses and their effects on people, particularly the middle and working classes. The history of fiat currency is rife with such examples. Most notorious are cases in which the value of a currency falls to effectively zero, and savings are completely destroyed. In Venezuela and Zimbabwe, the sovereign currency was entirely obliterated. All told, 56 distinct hyperinflation events (defined as a period in which month-over-month inflation exceeds 50 percent) can be identified in history. All except one took place in the 20th or 21st centuries. The causes have differed and include war, political chaos, and sudden changes in economic regimes. But there is one constant: Each occurred in an economy with a discretionary, fiat monetary standard. No hyperinflation event has ever occurred in an economy where monetary policy was constrained by a commodity standard.
The destruction of a nation’s savings through uncontrolled hyperinflation is a modern phenomenon. Of course, hyperinflation is not the only form of monetary collapse. Monetary policy, if misused, can be a powerful tool for confiscation, effectively enabling an unconsented redistribution of societal resources. All too often, monetary reforms take citizens by surprise and strip them of their purchasing power. Because citizens tend to save either directly or indirectly through instruments tied to government debt and the currency, sharp changes in monetary direction often come at the expense of savers.
Inflation, defaults, and monetary chaos tend to hollow out society. Historical accounts of currency instability and the subsequent destruction of savings are often dry and mired in jargon, and they overlook the enormous human cost of monetary failures. Worse, the frequency of financial crises has dramatically increased since the Bretton Woods system ended. Between 1975 to 2009, historians have noted 224 distinct currency crises, a rate of over six per year.
Ironically, the increasing frequency and intensity of monetary instability is occurring amidst increasing confidence on the part of modern central bankers. In 2017, then-Federal Reserve Chair Janet Yellen said she did not believe there would be another financial crisis in our lifetimes. Developed central banks today facilitate state largesse by monetizing debt, and some developed central banks now directly support government expenditure with monetary issuance. As quantitative easing has become commonplace, central banks are reinterpreting their mandates and expanding their scope.
Despite the expanded role for central banks, financial crises are not obsolete. Sovereign defaults in 2020 were the highest in more than 20 years, while the ratio of sovereign credit downgrades to upgrades was an all-time high of 10:1. However, access to the most credible sovereign currencies is highly contingent on a person’s place of birth. Today, 1.3 billion individuals worldwide live under double- or triple-digit inflation.
1.2 The relevance of Bitcoin to society today
Today, Bitcoin is a globally relevant monetary institution which provides a non-state, non-bank means of wealth storage, as well as an apolitical, neutral transactional medium. While many people use intermediaries and custodians to store their bitcoin – in the same manner that many individuals find it convenient to own gold in a paper format – they can also own the asset directly, on a laptop or smartphone. The aggregate value of all the outstanding units of Bitcoin stands at around $700 billion.
Aside from being a means to transport wealth through time and space via a system with predictable rules and sound assurances based on cryptography, Bitcoin also facilitates the final settlement of value with no counterparty risk. Bitcoin settles billions of dollars’ worth of transactions every day without meaningful interruption or downtime, granting users predictable, strong finality within a few blocks. In April 2021, an estimated $15 billion worth of bitcoin transfers were settled every day. In its first 12.5 years of existence, Bitcoin settled hundreds of individual billion-plus dollar transactions without incident. Thanks to its history of largely faultless, continuous operation, Bitcoin is widely considered a sound and credible global settlement system.
These settlement assurances are granted by the proof-of-work process in a setting with no ultimate coordinator or leader. Alternative systems that appear less costly are based on centralized models with a handful of ultimate arbiters who determine the valid transactional history. It is because Bitcoin strives to establish a neutral, apolitical, and unopinionated transactional medium that it must retain an open setting, in which any miner can leave and join at their pleasure. Proof of work permits this.
In addition, the proof-of-work mechanism mediates the issuance of new bitcoins by effectively auctioning them off in a free market environment with open competition. Bitcoin’s free-market issuance model ensures that no small, privileged group can emerge with sole access to the monetary spigot. The proof-of-work issuance method – whereby miners spend electricity and computational resources to acquire new units – establishes a real-world cost for bitcoin, requiring miners to “buy in” if they want to occupy the position of the mint. This compares with fiat systems in which a handful of privileged entities can create arbitrary numbers of currency units at no cost to themselves.
For a nascent technology, only 12 years into its lifetime, Bitcoin has achieved a remarkable level of adoption. The Cambridge Center for Alternative Finance estimated in 2020 the number of cryptocurrency users at between 101 and 191 million worldwide. The cryptocurrency exchange and brokerage Coinbase alone boasts 56 million users in 100 countries. A NYDIG survey found 46 million bitcoin owners in the US alone. Crypto.com estimates there were 106 million cryptocurrency users in January 2021, of which 71 million owned bitcoin. While precise estimates are hard to obtain, Bitcoin is today likely relevant to the lives of well over 100 million people worldwide.
While a large share of the capital invested in Bitcoin is from American, European, or Chinese investors, the per-capita penetration figures tell a story of global adoption. Based on an index quantifying grassroots adoption compiled from on-chain flow, survey data, and measurable peer-to-peer Bitcoin exchange transactions, it is evident that Bitcoin’s greatest per-capita penetration is in Sub-Saharan Africa, Latin America, Eastern Europe, and Southeast Asia.
The 20 most crypto-active states, measured by usage per unit of population, are listed in Table 1. The US and China make the list, but it is otherwise largely dominated by emerging, frontier, and politically unstable markets. Some countries where citizens actively pursue crypto activities are in the midst of inflationary episodes – such as Venezuela, Argentina, and Nigeria. Others, like China and Ukraine, encumber citizens’ assets with robust capital controls. Most tellingly, it appears that users are attracted to Bitcoin at least partly due to the failure of local institutions. The top 10 states on the crypto adoption index on average score below the global average on measures of democracy and government integrity.


Bitcoin’s disproportionate adoption in states with weak currencies or inferior protections for private property stands to reason: It consists of an independent system of property rights that upholds the transactional freedom of individuals and permits savers worldwide to control their wealth directly, through a simple cryptographic key. Bitcoin is a non-sovereign global network available to anyone with Internet and a smartphone, and it offers a free monetary choice, granting savers worldwide the ability to opt out of their local regime. Moreover, the presence of freely available currency substitutes exerts a disciplinary force on central banks, punishing loose monetary policy. Thus, Bitcoin does not have to be fully adopted to improve the livelihoods of individuals living under erratic monetary regimes: The mere threat of currency substitution can encourage better behavior on the part of monetary authorities. Thus, Bitcoin has contextual relevance: It may not seem as compelling to some individuals who believe they live in stable monetary and financial settings, or under a government that respects property rights and the rule of law – but it becomes starkly relevant in their absence.
1.3 Energy consumption and civilizational progress
As we investigate later in this report, Bitcoin requires a considerable amount of energy. Before examining the likely trajectory of these emissions, we can consider humanity’s relationship with energy.
The story of civilization has been one of capturing and exploiting ever denser sources of energy. The greatest tools for reducing poverty and improving the quality of life have been the development of industrial processes, electrification, industrialized agriculture, air conditioning and heating, and mechanized transport. For example, since Deng Xiaoping’s reforms in China in the 1980s, 850 million Chinese have been pulled out of poverty through industrialization and urbanization – all of which required the use of abundant energy.
The world is not yet fully electrified, and a modern, developed standard of living is far from ubiquitous. Indeed, 760 million people today live without access to reliable electricity. Only one-third of all households worldwide have access to air conditioning and just 8 percent of the 2.8 billion people living in the hottest climates.
Over the long term, primary energy consumption is closely correlated with GDP (see Chart 2). A cross-sectional analysis of GDP and energy consumption per capita reveals that the wealthiest countries consume, by far, the most energy (see Chart 3A). There is simply no way to achieve a high standard of living without producing and consuming abundant energy.

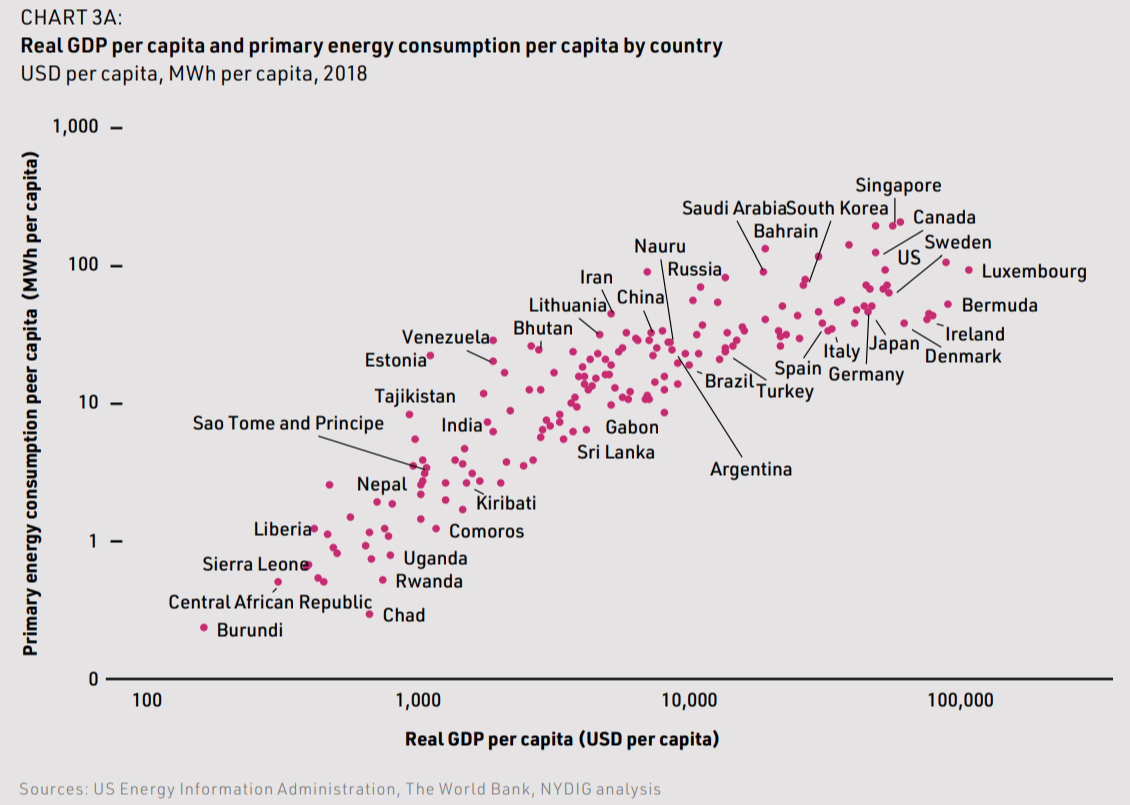
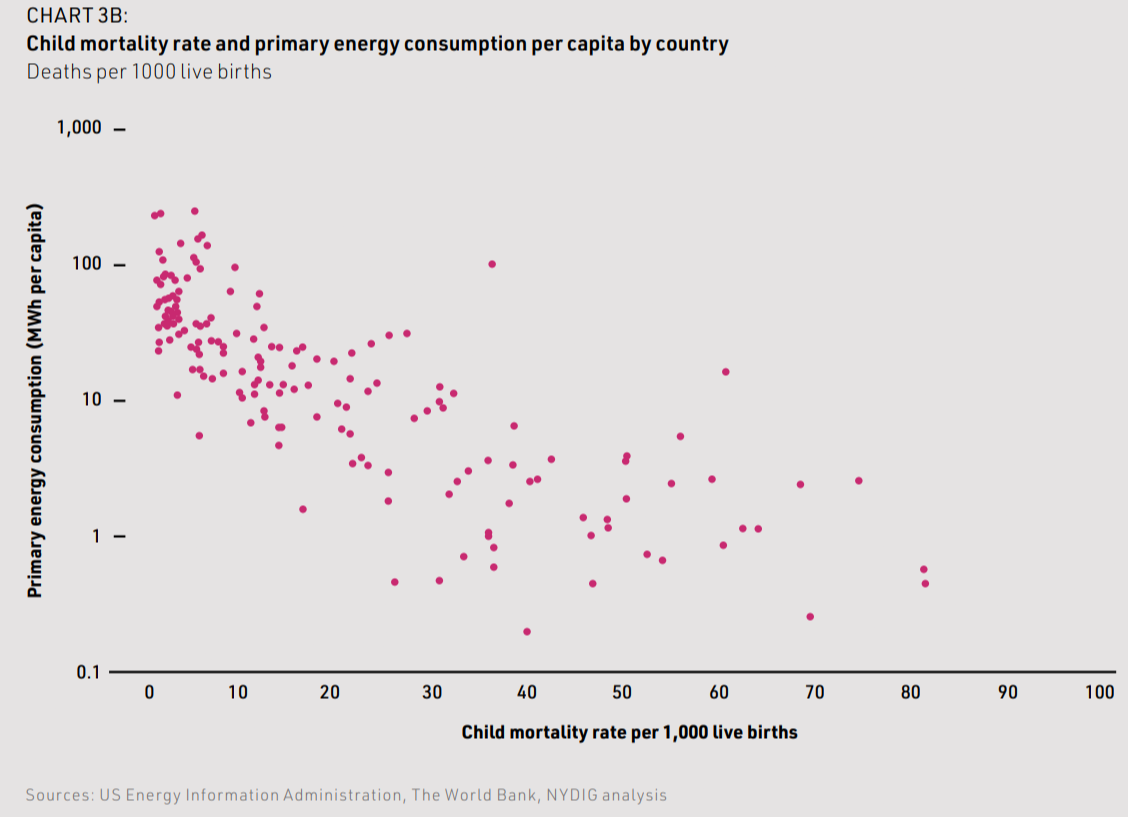
Equipping citizens with abundant energy is essential to attaining a high standard of living. Indeed, because abundant energy grants us so many luxuries, society rarely engages in public debate about the social merit of these technologies. Air conditioning in hot countries is taken for granted. When blackouts shut off air conditioning, the reaction is to lament the lost convenience rather than accept the pre-industrial default conditions. The social contract that has been sketched out in the West holds that households and industries freely consume energy that they have paid for, while policymakers regulate the grid and mitigate its externalities.
Numerous technological innovations consume vast amounts of energy and are generally perceived to be valid uses of that energy given their societal utility. Refrigeration, air conditioning, electric fans, marine and aviation transport all dramatically enhance our quality of life but consume copious amounts of energy in so doing. We mention these industries not to say that their usage should be curtailed, but because they provide evidence for the correlation between energy production and human flourishing. These industries make summers tolerable and winters survivable, make domestic tasks convenient, facilitate a system of global commerce, and make worldwide travel possible.
As civilization progresses, we will continue to discover novel means of producing sufficient energy in a sustainable manner. As new forms of energy become more abundant, they will unlock experiences that were hitherto unavailable. Just as gasoline and combustion engines made car travel possible, and efficient batteries enabled personal computation and constant communication, new means of energy production and storage will continue to move civilization forward. Our challenge is to meet society’s ever-increasing demand for energy in a manner consistent with any relevant planetary constraints. The alternatives – regressing to a pre-industrial state or barring the global south from industrializing – are not practical or moral.
Like the technologies mentioned above, Bitcoin is a novel innovation that can improve global quality of life. It offers savers the chance to control their wealth directly in a sound, non-state monetary system, bound by nondiscretionary rules. As such, Bitcoin offers a uniquely potent system of property rights. Like all breakthrough technologies, the full impact of Bitcoin’s merits and capabilities has not been immediately appreciated by its entire addressable market, though it is following a rapid adoption curve. Because Bitcoin offers a unique monetary medium with a clearly established value proposition, it can be situated among other energy-intensive innovations that improve the quality of our lives.
Section 2: Bitcoin’s carbon emissions
This section explores why Bitcoin mining requires significant electricity consumption, as well as examining its historical electricity consumption and the resulting carbon emissions. It contextualizes Bitcoin mining’s electricity consumption and carbon emissions, comparing them to global levels and to those from other innovations and commodities. We address the following questions:
- How do Bitcoin’s electricity consumption and carbon emissions compare globally?
- Why is Bitcoin mining electricity intensive?
- What is the electricity consumption of Bitcoin mining?
- What carbon emissions are associated with this electricity consumption?
- How does Bitcoin compare to other innovations and commodities?
Summary
- Bitcoin’s absolute electricity consumption and carbon emissions are not significant in global terms, representing 0.04 percent of global primary energy consumption, 0.2 percent of global electricity generation, and 0.1 percent of global carbon emissions.
- Bitcoin mining is electricity intensive by design to provide security to the network.
- The electricity consumption of Bitcoin mining is estimated using a bottom up approach, based on network hashrate and machine efficiency. We estimate that Bitcoin mining consumed 62 terawatt hours (TWh) of electricity in 2020. This increased to an annualized rate of 92 TWh in March 2021, before falling to 49 TWh in July following the Chinese crackdown on mining.
- Bitcoin’s carbon emissions are primarily driven by the carbon intensity of miners’ electricity mix and their electricity consumption. We estimate that Bitcoin mining resulted in total emissions of 33 million tonnes of carbon dioxide (MtCO₂ ) in 2020. In line with the electricity consumption, emissions reached an annualized peak of 49 MtCO₂ in March 2021 but dropped to 27 MtCO₂ in July.
- Bitcoin’s absolute carbon emissions are low compared both to other innovations that are energy intensive, such as aviation transport and air conditioning, and to major mined products.
2.1 How do Bitcoin’s electricity consumption and emissions compare globally?
Bitcoin’s absolute electricity consumption and carbon emissions are not significant in global terms, representing 0.04 percent of global primary energy consumption, 0.2 percent of global electricity generation, and 0.1 percent of global carbon emissions.
Global energy consumption, carbon emissions and electricity generation
Energy can be classified into two broad types: non-renewable and renewable. Non-renewable energy sources include coal, oil, and natural gas – which are fossil fuels – as well as the raw material used to create nuclear energy. Renewable energy sources include hydro, solar, wind, and geothermal.
Since the industrial revolution, annual global primary energy consumption has increased dramatically, from around 6,000 TWh in 1800 to more than 170,000 TWh in 2019. This increase has been accompanied by a similar rise in global emissions, increasing from around 30 million tonnes of carbon dioxide (MtCO₂ ) per year in 1800 to around 36,000 million in 2019 (36 GtCO₂ ). In the International Energy Authority (IEA) sustainability development scenario, global carbon emissions rapidly decrease, falling to 15,000 MtCO₂ in 2040 (see Chart 4).

Primary energy consumption refers to all uses of unconverted fuel, including for transport, heating, and the generation of electricity. In 2019, global electricity generation was around 27,000 TWh. It was used for purposes including lighting, heating, cooling, and refrigeration, as well as to operate household appliances, computers, machinery, and transport systems. In the IEA’s Sustainable Development Scenario, global electricity generation increases to around 39,000 TWh by 2040.
Bitcoin’s electricity consumption and carbon emissions are not significant in global terms. Its estimated electricity consumption of 62 TWh in 2020 represented just 0.04 percent of the global primary energy consumption of 170,000 TWh and 0.2 percent of the global electricity generation of 27,000 TWh (see Section 2.3). Bitcoin’s carbon emissions were 33 MtCO₂ in 2020, or 0.1 percent of the global total of 36,000 MtCO₂ (see Section 2.4).
In the future, under a wide range of Bitcoin price scenarios, Bitcoin’s electricity consumption and carbon emissions will remain a small proportion of global totals. Even under our highest price scenario, where Bitcoin’s electricity consumption and carbon emissions peak at 706 TWh and 234 MtCO₂ , this only accounts for 0.4 percent of global primary energy consumption, 2.0 percent of electricity generation, and 0.9 percent of carbon emissions (see Sections 3.1 and 3.2).
Electricity grid and renewables
Traditionally, electricity has been generated in large central power plants, fueled by either coal, natural gas, nuclear reactors, or water. This electricity is transported initially through the transmission network at very high voltages, before being distributed to customers through local distribution networks at lower voltages. Together, these networks are termed the grid (see Chart 5). This process wastes significant energy. Only around 40 percent of the energy content of coal is converted into electricity; the rest is lost as waste heat. Natural gas is more efficient, but still at best 60 percent of its energy content is converted. Furthermore, between 4 and 10 percent of electricity generated is then lost as heat in the transmission and distribution networks. In total, around 50,000 TWh of energy is wasted every year due to inefficiencies. Bitcoin’s electricity consumption is equivalent to just 0.1 percent of this annual waste.
The global share of electricity generated from renewables – which includes hydro, solar, wind, geothermal, biomass and marine energy – increased from 20 percent in 2010 to 27 percent in 2019. This rise was driven by declining costs, especially of solar and wind energy, plus growing demand resulting from increasing environmental concerns (see Box 1). Using renewable sources instead of fossil fuels significantly lowers the carbon emissions associated with electricity generation.
Renewables are expected to grow rapidly in the future, as their costs continue to decline, and environmental concerns persist. This trend may ultimately lead to the decarbonization of electricity grids. In the IEA 2020 Sustainable Development Scenario, renewables reach a share of 52 percent in 2030 and 72 percent in 2040, as coal, gas, and oil are gradually phased out (see Chart 6). Further growth in renewables would be required to achieve a “net-zero” world, in which there is a balance between the amount of carbon dioxide emitted and the amount removed from the atmosphere.


However, solar and wind only generate electricity in the right weather conditions – when the sun shines and the wind blows – unlike fossil fuel plants, which can produce electricity on demand. Therefore, at times, fossil fuel plants are needed to fulfill electricity demand that renewables cannot meet. At times, renewables can also supply more electricity than is needed. As excess electricity cannot be easily stored, generation must be curtailed by deliberately reducing the output of a generator below its full potential in order to balance supply with demand from the grid. In the future, these problems might be solved through battery storage. But today batteries are expensive, particularly if the electricity generated needs to be stored for more than a few hours. Currently, therefore, fossil fuels are needed alongside renewables to ensure that the supply of electricity can meet demand.
At any given time, a grid typically transmits electricity generated from a mix of fossil fuels, nuclear energy, and renewables. Carbon emissions per unit of electricity produced will therefore vary according to the specific mix, which will change over time. A grid’s carbon intensity is typically measured in grams of CO₂ per kWh of electricity produced. Carbon intensity levels can reach up to 1,000 gCO₂/kWh for coal or about 400 gCO₂/kWh for gas, but are 0 gCO₂/kWh for renewables and nuclear energy (excluding any emissions associated with the manufacture and distribution of these technologies). In many countries, coal remains the dominant source of electricity: China, for example, produced 65 percent of its electricity from coal in 2019. In other countries, gas is the dominant source: Russia produced 49 percent of its electricity from gas in 2019 and the US 38 percent. In Europe, renewables are the biggest source, at 37 percent in 2019.
It is not technically possible for a customer to buy only renewable electricity from a grid, because the electricity supplied reflects the mix of fuels that feed it. Moreover, electricity markets – where electricity is bought and sold by consumers and generators – are becoming increasingly interconnected, so it is more difficult to trace electricity supply to a local region. As a result, carbon intensity has become reflective of the electricity mix across a continent or region rather than a specific country. For example, most markets in Europe now operate in combination with one another, and countries are usually importing or exporting electricity at any point in time.
To encourage the adoption of renewables, many electricity markets have adopted renewable energy certification programs. Under these, renewable generators earn certificates for each megawatt hour (MWh) of electricity generated from a renewable energy source, demonstrating that they have supplied a specific volume of renewable electricity to the grid. They can then sell these certificates to energy consumers, who use them to demonstrate that they have effectively purchased electricity generated from a renewable source. The certificates can be purchased either together with the physical energy generated by the renewable sources or separately. Through programs such as this, high electricity consumption does not necessarily translate into high carbon emissions.
Box 1: Renewable energy costs
According to the International Renewable Energy Agency (IRENA), the costs of renewables have declined dramatically
due to “improving technologies, economies of scale, increasingly competitive supply chains and growing developer experience.” The decline has been most significant for electricity generated by solar and wind electricity. Between
2010 and 2019, the global-weighted average levelized cost of electricity (LCOE) – a measure of the lifetime cost of generating electricity – fell by 82 percent for utility-scale solar photovoltaics (PV), 38 percent for onshore wind, and
29 percent for offshore wind. Auction prices have shown continued declines in these costs in 2020 and 2021, although the rate of decline is decreasing, as technologies mature.As a result, renewable energy generation technologies have become cost-competitive with conventional fossil-fuel generation and have become a low-cost option for new installed capacity in most countries, spurring their growth over the past decade.


2.2 Why is Bitcoin mining electricity intensive?
Bitcoin mining is electricity intensive by design to provide security to the network.
The Bitcoin ecosystem consists of several entities, including the following: mining nodes, which create new blocks; non-mining nodes, which validate the entire history of the blockchain and doublecheck transaction validity in real time; and third-party exchanges and custodians, which conduct transactions and store bitcoin on behalf of users who choose not to own the asset directly. This report focuses exclusively on the electricity consumption of Bitcoin mining, as the consumption of other parts of the Bitcoin ecosystem is negligible.
Bitcoin mining has become more electricity intensive as the value of Bitcoin has risen. Miners compete to receive bitcoin rewards for finding the solution to random puzzles set by the Bitcoin protocol. Therefore, as the value of Bitcoin has risen, so has the level of competition. Miners compete by increasing their computational capacity, which then requires greater amounts of electricity. This requirement to expend electricity to solve the mathematical problems is essential to the proof-of-work mechanism (see Appendix 1). As proof-of-work is reliant on computational work, it is also a way to attach a real-world cost to blocks. This provides security to the network by making it costly – both in terms of electricity and mining hardware – for a potential malicious actor to gain control of the network and add fraudulent blocks to the blockchain.
2.3 What is the electricity consumption of Bitcoin mining?
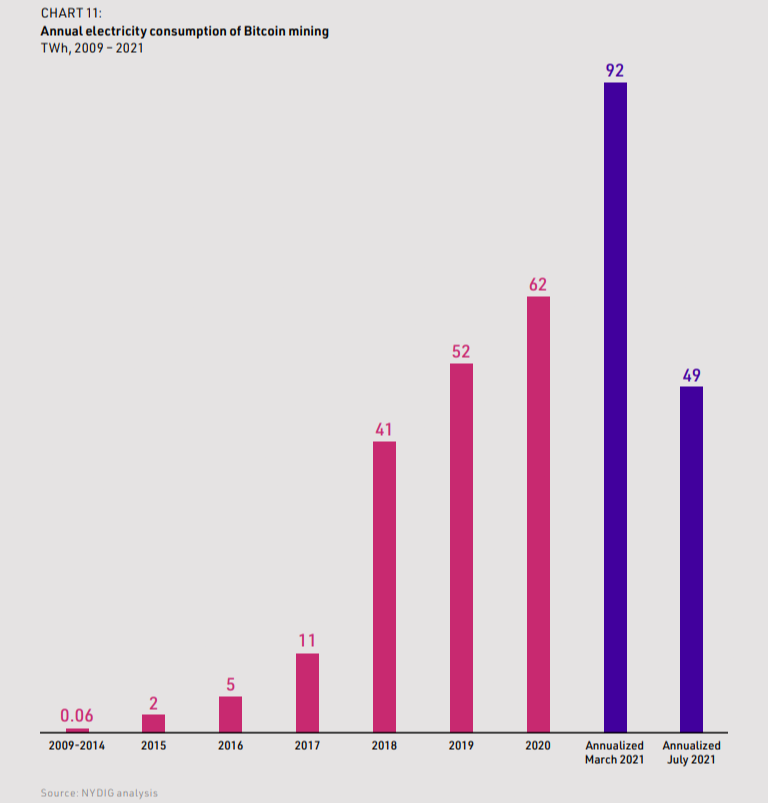
The electricity consumption of Bitcoin mining is estimated using a bottom up approach, based on network hashrate and machine efficiency. We estimate that Bitcoin mining consumed 62 terawatt hours (TWh) of electricity in 2020, equivalent to 0.04 percent of global primary energy consumption and 0.2 percent of global electricity generation. This increased to an annualized rate of 92 TWh in March 2021, before falling to 49 TWh in July following the crackdown on mining.
Methodology
Our calculation of the historical electricity consumption of Bitcoin miners is a function of the network hashrate and machine efficiency. These enable the average electricity required per hash to be derived.
The network hashrate is publicly available and is measured in terahashes per second (TH/s), or 10^12 calculations per second (see Chart 9). It has risen rapidly since 2018 with the development of faster machines and the increasing attraction of mining with the rising Bitcoin price. The recent crackdown on mining in China has driven the recent rapid fall in hashrate (see Box 3).

The average amount of electricity required per hash is determined by the average energy efficiency of mining machines on the network, weighted by their share of the hashrate. It is measured in joules per terahash (J/TH). We have assumed that the 93 machine classes referenced in a study by the Cambridge Centre for Alternative Finance are representative of the mining machine market from 2015 to 2021. As the energy efficiency of each machine class is known, the only unknown variable is the distribution of network hashrate across these machine classes over time. This is needed to determine a weighted average energy efficiency of all mining machines for a given period.
To determine the distribution through time of network hashrate by machine class, we modeled a typical lifespan for each machine class. This was based on factors including release date, calculated retirement date, efficiency, and hashrate. The lifespan parameter of each machine class was refined further, by assuming that machines of a particular class will never be used on days when the electricity cost per hash is greater than the average revenue per hash – that is, when the machine is unprofitable.
External reference points were also used to further calibrate the lifespan parameter, such as sales figures from listed hardware manufacturers and data signatures within mined blocks. For any given day, we were then able to compare the progress of each machine class along its lifespan and thus generate a distribution of hashrate. That yielded a weighted average energy efficiency of the mining machines on the network. This, when combined with the known hashrate, allowed us to estimate the electricity consumed by Bitcoin mining machines on any given day.
Bitcoin mining operations, like data centers, generally use more electricity than required to simply run their machines, mostly because of the need for cooling and other IT equipment. The mining companies we interviewed suggested that electricity usage not associated with running the mining machines amounts to approximately 7.5 percent of the energy required to run the machines themselves. This gives a power usage effectiveness (PUE) of 1.075, which is the ratio of the total electricity supplied to that required to run the mining machines. After multiplying our electricity consumption estimates by the PUE of 1.075, we calculated the daily electricity consumption for global Bitcoin mining operations on any given day.
Results
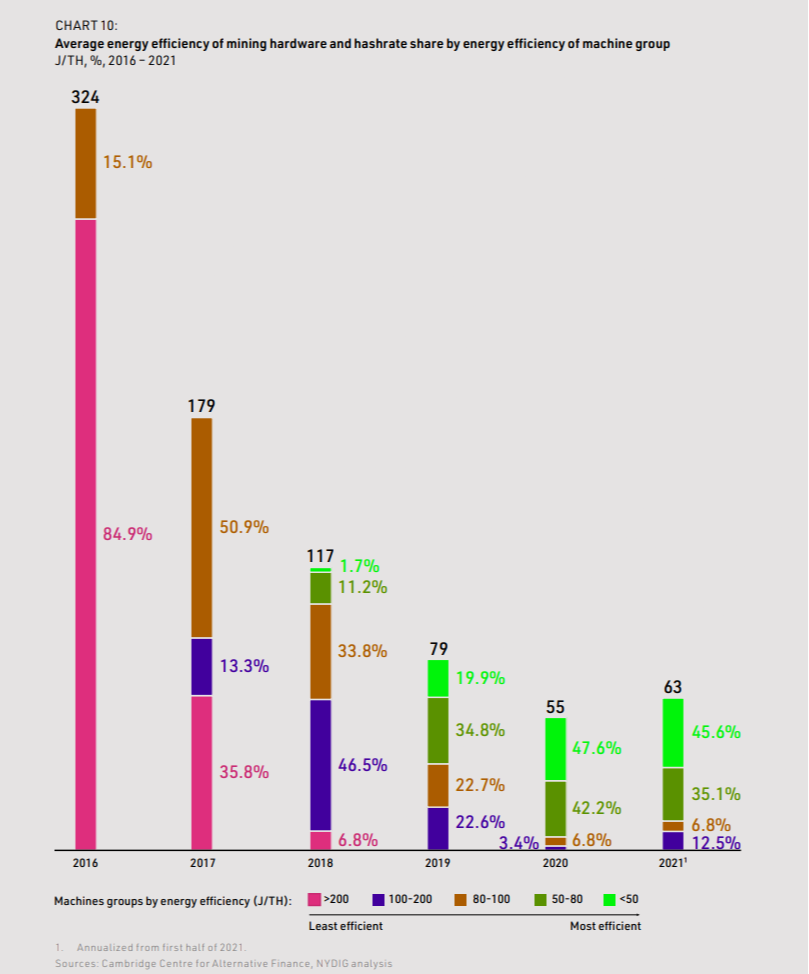
The weighted average energy efficiency of mining machines on the network improved significantly from 2016 to 2020 in line with the development and release of more-efficient machines (see Box 2). Despite the general trend of rising Bitcoin prices from 2016 to early 2021, the rapid increase in hashrate – combined with the continued halving of the block subsidy – led to a decrease in miner revenue per terahash over this period. As a result, the profitability of older, lessefficient machines has been eroded, and they have been replaced by newer, more-efficient machines. This substantially increased the average energy efficiency of mining hardware from 2016 to 2020 (see Chart 10).
The mining companies we interviewed suggested that a typical class of machine in 2021 has a lifespan of about three or four years, after which it is replaced by more-powerful and more-efficient models. The rise in Bitcoin’s price and the consequent demand for machines over the past decade have led hardware manufacturers to invest in producing more efficient microchips for these machines. Historically, and in line with Moore’s Law, chip efficiency has doubled approximately every two years. However, this has slowed in recent years and looks likely to continue to slow to a doubling every three to four years, likely increasing the lifespan of each machine class.
Nevertheless, some older machines could be switched back on if increases in the Bitcoin price make them profitable. Our model, together with data signatures from mined blocks, has verified this in the case of the Antminer S9 – one of the most popular mining machines in 2018. Its share of hashrate began to decline in 2020 as it approached the end of its lifespan but then spiked in early 2021 as the price of Bitcoin rose.
The electricity consumption of Bitcoin mining remained relatively low until late 2017, when the first jump in Bitcoin’s price attracted a wider community of miners. After that, more miners competed to solve the mathematical problems, and the hashrate and electricity consumption grew rapidly, reaching 62 terawatt hours (TWh) in 2020. That was equivalent to 0.04 percent of global primary energy consumption and 0.2 percent of global electricity generation.
Box 2: Evolution of Bitcoin mining
Bitcoin mining has evolved over the past decade from a small-scale activity possible on personal computers tolarge-scale “mining farms”. Similar in appearance to a data center, a mining farm consists of racks of specialized
energy-efficient computer rigs, which perform hashes to solve the complex mathematical problems.
Over the past decade, these machines have undergone rapid technological development. Initially, it was possible for an average central processing unit (CPU) or graphics processing unit (GPU) graphics card to mine Bitcoin because of the low amount of computing capability on the network: There were fewer mining machines than today; equipment was relatively unadvanced; and the mathematical problems set were correspondingly less complex. In 2013, large-scale miners began to use application-specific integrated circuits (ASICs) designed for Bitcoin mining. These chips can help mine Bitcoin at a faster rate and using far less electricity than a traditional PC CPU unit. Since their launch ASIC chip performance has continued to rapidly improve, increasing both their capacity and energy efficiency.
To maximize their revenues, miners aim to run their machines 24/7. This typically requires connection to the grid, since it provides a constant supply of electricity, and independent renewable sources only produce electricity intermittently. To maximize their operating profits, miners aim to run the most efficient machines possible, as this reduces their energy cost per hash.
Box 3: Chinese crackdown on mining
The Cambridge Centre for Alternative Finance has estimated that in 2020, 65 percent of Bitcoin mining took place in China. In April 2021, it reported a substantially lower proportion of 45 percent, as the US became the dominant buyer of the most powerful mining hardware. However, in May and June 2021, various Chinese state-backed bodies at the provincial and national levels announced a series of measures to restrict Bitcoin activities.
At the national level, three Chinese industry groups overseeing the financial sector warned their members across the nation to stay clear of any financing, exchange or trading activities related to cryptocurrencies.
At the provincial level, numerous Chinese states have also announced restrictions on cryptocurrency activity. Some of these have been cautionary announcements: Beijing said it would ‘clamp down on Bitcoin mining and trading behavior,’and Inner Mongolia issued a ‘draft guideline’ explaining how local authorities can crack down on Bitcoin mining. Other states have been stronger in policing crypto activity: Sichuan ordered the suspension of the 26 largest mining farms, telling them to leave the country by September 2021, and Qinghai barred local officials from setting up or permitting crypto-mining projects.
These announcements have precipitated an exodus of miners from China. As a result, the global hashrate decreased by more than half, from 190 exahash per second on 9 May 2021 to 90 exahash per second on 3 July 2021. This 53-percent decrease corroborates the Cambridge Centre for Alternative Finance’s initial estimate that more than half the hashrate had previously been in China.
While a justification for the Chinese crackdown has not been publicly announced, governments across the world are increasingly viewing Bitcoin as a threat to state monetary sovereignty. For example, Nigeria and Qatar have also taken steps to limit Bitcoin trading and Bitcoin transactions. In the future, a Bitcoin-friendly political environment will be critical for stable mining operations.
2.4 What carbon emissions have resulted from historical electricity consumption?
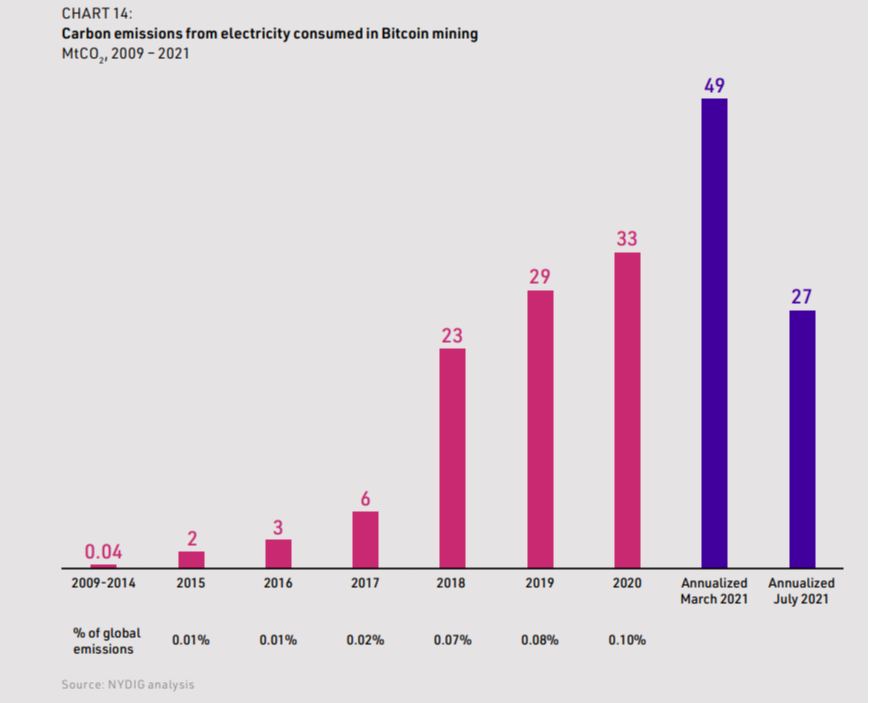
Bitcoin’s carbon emissions are primarily driven by the carbon intensity of miners’ electricity mix and their electricity consumption. We estimate that Bitcoin mining resulted in total emissions of 33 million tonnes of carbon dioxide (MtCO₂ ) in 2020, equivalent to 0.1 percent of the global total. In line with electricity consumption, annualized carbon emissions peaked at 49 MtCO₂ in March 2021 but dropped to 27 MtCO₂ in July.
Methodology
Estimating the carbon emissions from Bitcoin mining requires knowledge of its location and of the carbon intensity of the local electricity market. In 2020 and early 2021, most Bitcoin mining took place in China; the government crackdown in May and June 2021 then significantly reduced the Chinese share of hashrate (see Box 3.). The newer, more economically viable, mining machines in China are likely to be exported to new locations, while older, less-profitable machines are likely to be retired. This section assesses the historical emissions of Bitcoin, both before and immediately after the Chinese crackdown. Later, Section 3.2 discusses where Bitcoin miners are expected to be located in the future.
In most cases, we have assumed that Bitcoin miners run their mining rigs on electricity from the local grid. Though some mining companies have announced future direct partnerships with power stations, we found limited evidence of Bitcoin miners running their operations on fully off-grid electricity – that is, obtaining all their electricity directly from a power station not connected to a grid. Therefore, our methodology relies on the assumptions that all Bitcoin miners used electricity from their local grids, and that the carbon intensity of their electricity reflects those grids’ mixes. Our methodology does not factor in miners’ specific abatement measures, such as carbon offsets and direct renewable electricity procurement (see Section 3.3.) Therefore, our carbon assessment can be interpreted as a baseline estimate for the industry before action.
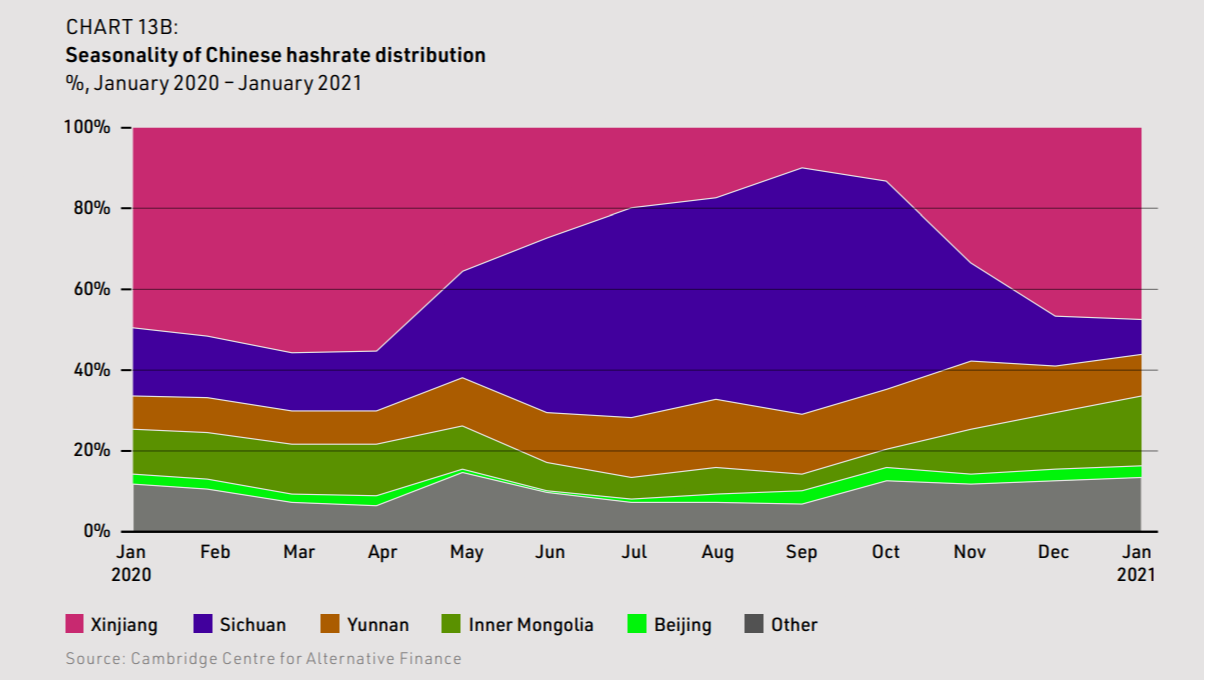
Our primary dataset, from the Cambridge Centre for Alternative Finance, segmented hashrate to a national level except China where data is collected at a provincial level. This allowed us to capture the annual migration of miners to areas rich in hydroelectric power during the wet season, a common practice before the government crackdown (see Box 4).
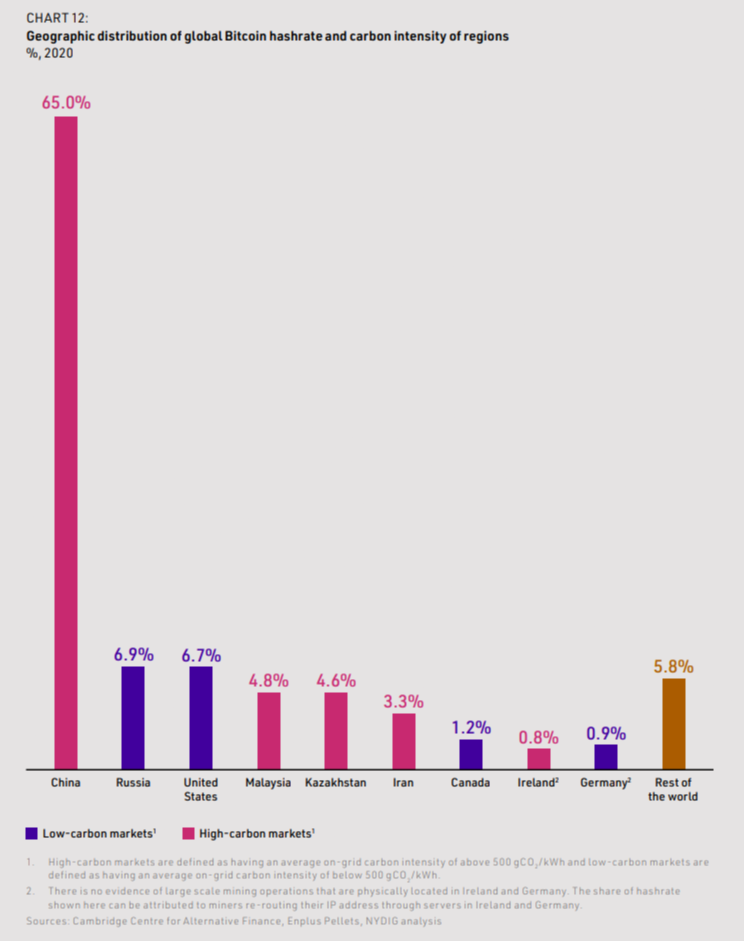
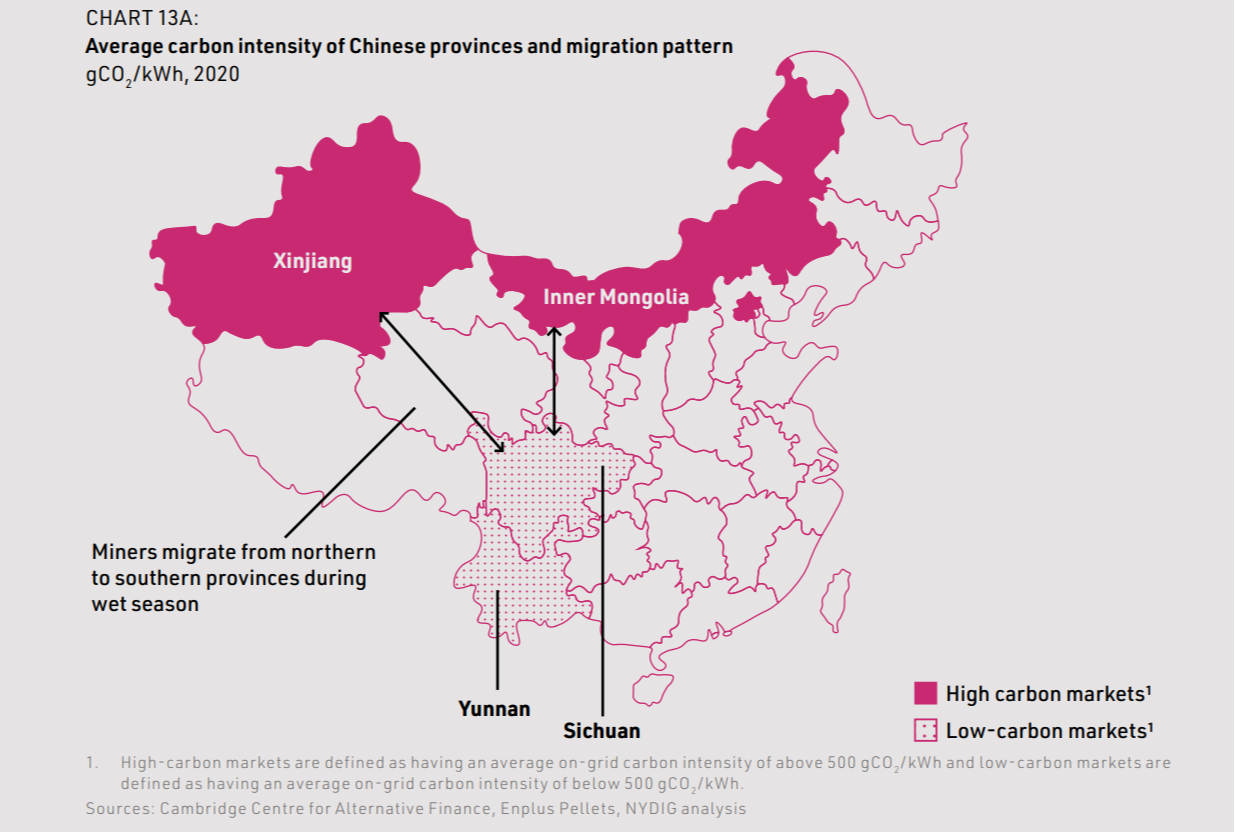
According to this data, until the end of 2020, up to 65 percent of Bitcoin mining occurred in China – a figure that has been corroborated by the aftermath of the government crackdown (see Box 3). Within China, most mining occurred in Xinjiang and Sichuan. The other top countries for Bitcoin mining were Russia – 6.9 percent; United States – 6.7 percent; Malaysia – 4.8 percent; Kazakhstan – 4.6 percent; and Iran – 3.3 percent (see Charts 12 and 13).
To estimate the geographic distribution of hashrate in July 2021, immediately after the Chinese crackdown, we excluded China and used the same distribution among other countries as published by the Cambridge Centre for Alternative Finance for the month of April 2021. In April 2021, there had already been a significant decrease in hashrate in China and a proportional increase in the US, which dominated purchases of mining hardware during the first half of 2021. This resulted in the following distribution of hashrate for the top locations: United States – 31 percent; Russia – 13 percent; Kazakhstan – 15 percent; Malaysia – 6 percent; and Iran – 9 percent.
Box 4: Seasonal migration of miners in China prior to the government crackdown
Miners consider several factors when choosing locations, including the electricity price, regulatory environment, infrastructure availability, access to mining machines, and capital costs. Prior to the government crackdown in May and June 2021, China was a common mining location due to its cheap hydro and coal-fired electricity, favorable regulatory environment, cheap and easy access to mining machines (many of which are produced in China), and low overheads.
China has cheap hydroelectric energy due to the overbuilding of dams in its southern provinces, Sichuan and Yunnan. During the wet season, these generate more electricity than can be used, because local demand is limited, as is the potential to export electricity through transmission lines. As a result, there is a significant amount of cheap, excess hydroelectricity. Bitcoin miners took advantage of this and relocated to these provinces during the wet season.
However, the economics of Bitcoin mining require year-round operation. In the dry season, Bitcoin miners moved to other provinces with relatively cheap electricity. These were usually coal-rich, such as Xinjiang. This seasonal movement is demonstrated by 2020 data from the Cambridge Centre for Alternative Finance, which estimates that Sichuan hosted up to 41 percent of the global hashrate in September during China’s wet season but only 7 percent in December during the dry season.
There is no alternative market for the hydroelectricity consumed by the miners. If not consumed, the generators have no other option but to release water downstream. Thus, the carbon intensity of mining in these provinces is effectively zero. Nevertheless, the seasonal migration back to provinces with coal-generated electricity has historically neutralized the benefits of carbon-free hydroelectricity. The average carbon intensity of Bitcoin mining in China, after accounting for seasonal migration, is estimated at 508 gCO₂/kWh. This is only 12 percent less than China’s average grid intensity across all provinces, which is 581 gCO₂/kWh.
Results
We estimate that Bitcoin’s 2020 electricity consumption of 62 TWh resulted in total emissions of 33 million tonnes of carbon dioxide (MtCO₂ ), equivalent to 0.1 percent of the global total. Over the lifetime of Bitcoin – that is, from 2009 to 2020 – we estimate that mining has caused aggregate emissions of 96 MtCO₂ . Bitcoin emissions from 2009 to 2014 were markedly low, largely due to the low-price environment and correspondingly low hashrate, which required fewer calculations and less energy to add a block to the blockchain. As with electricity consumption, Bitcoin’s carbon emissions in 2021 have been highly volatile. They reached an annualized peak of 49 MtCO₂ in March 2021 but fell to 27 MtCO₂ in July following the Chinese crackdown on mining. This reduction is primarily a result of the reduced global hashrate. If the hashrate remains at these reduced levels for the remainder of 2021, then carbon emissions from Bitcoin mining in 2021 will be lower than they were in 2020 (see Chart 14).
In modeling Bitcoin’s 2020 electricity consumption and carbon emissions, we made several baseline assumptions. These are listed in Table 2, along with a lower bound and upper bound for each assumption and their implication on our results. Our model is most sensitive to the average energy efficiency of mining machines, which we derived from the distribution of hashrate across machines. However, at most this has an impact of between -23 percent and +10 percent on our estimate for 2020 carbon emissions.

2.5 How does Bitcoin compare to other innovations and commodities?
Bitcoin’s carbon emissions are low compared both to other innovations that are energy intensive, such as aviation and marine transport, air conditioning, and to major mined products.
Bitcoin’s absolute electricity consumption and carbon emissions are far less than those of other innovations that are energy intensive but generally perceived to be valid uses of that energy given their societal utility. Energy consumption from marine and air transport are significant, eclipsing Bitcoin mining’s electricity consumption by factors of 49 and 65 respectively (see Chart 15).
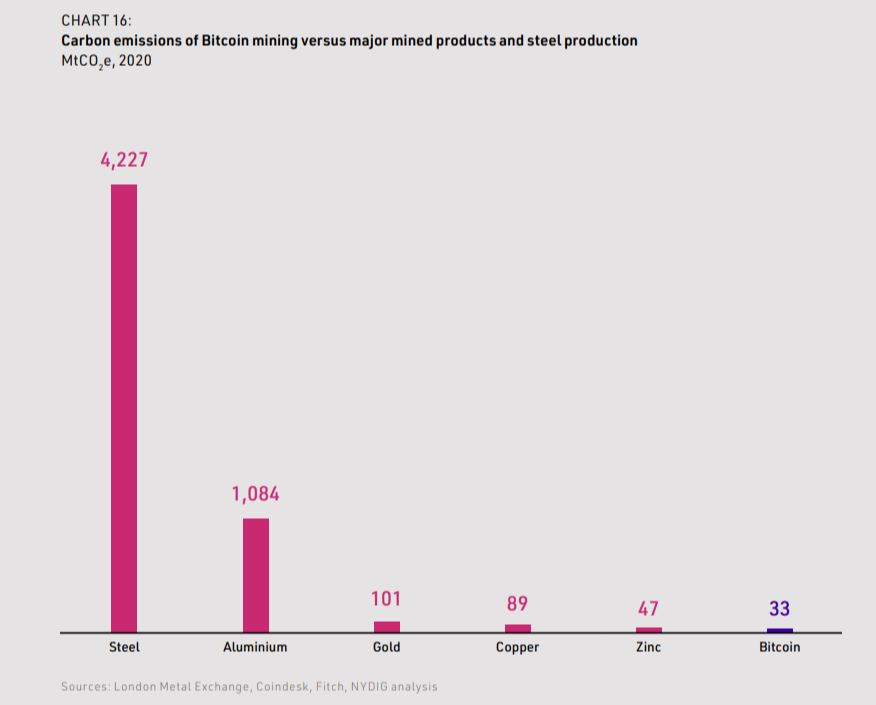
Bitcoin’s 2020 carbon emissions of 33 MtCO₂ were also significantly less than those for the extraction and production of zinc, copper, aluminum, and steel. Emissions from gold production were estimated to be equivalent to around 101 MtCO₂e more than three times Bitcoin’s emissions (see Chart 16).
Section 3: Bitcoin’s future carbon emissions
This section explores the outlook for Bitcoin’s electricity consumption and carbon emissions and sets them in the context of global consumption and emissions. We address the following questions:
- How will Bitcoin’s electricity consumption evolve under different scenarios?
- How will Bitcoin’s carbon emissions evolve under these scenarios?
- What decarbonization levers could reduce emissions?
Summary
- Bitcoin’s electricity consumption is driven primarily by the total revenue pool available to miners and their electricity costs. Under a wide range of price scenarios, Bitcoin’s electricity consumption increases and peaks within the next decade, then declines with each halving of the block subsidy.
- Bitcoin’s electricity consumption will increase significantly within the next decade if the price of Bitcoin continues to rise. However, even under our high price scenario, where Bitcoin’s electricity consumption peaks at 11 times its 2020 level, it will only account for 0.4 percent of global primary energy consumption and 2 percent of global electricity generation.
- Bitcoin’s future carbon emissions have been estimated using values for the future carbon intensity of grids and a baseline geographic distribution of hashrate. In all price scenarios, Bitcoin’s carbon emissions increase and peak within the next decade, before declining substantially due to grid decarbonization. Bitcoin’s carbon emissions will always be a small proportion of global emissions. Even at the peak of the high price scenario, Bitcoin’s emissions will only account for 0.9 percent of global carbon emissions.
- Bitcoin miners can reduce emissions in the short and medium term by buying carbon offsets, procuring renewable energy, favoring locations with renewable energy, and using wasted energy. Some companies are already leveraging these. In the long term, Bitcoin miners can benefit from grid decarbonization and likely advances in battery storage technology and the resulting lower storage costs.
3.1 How will Bitcoin’s electricity consumption evolve under different scenarios?
Bitcoin’s electricity consumption is driven primarily by the total revenue pool available to miners and their electricity costs. Under a wide range of price scenarios, Bitcoin’s electricity consumption increases and peaks within the next decade, then declines with each halving of the block subsidy. Bitcoin’s electricity consumption will increase significantly within the next decade, if the price of Bitcoin continues to rise. However, even under our high price scenario, where Bitcoin’s electricity consumption peaks at 11 times the 2020 level, it will only account for 0.4 percent of global primary energy consumption and 2 percent of global electricity generation.
Methodology
Two primary variables will drive Bitcoin’s future electricity consumption: the total revenue pool available to miners and the absolute cost of electricity. A higher revenue pool will lead to greater participation in mining, thereby increasing the hashrate and the amount of electricity needed to mine a block. After analyzing miners’ cost structures, we estimate that approximately 50 percent of the total revenue pool is spent by miners on electricity as a long-term average (see Box 5). Based on studies by Digiconomist and the Cambridge Centre for Alternative Finance, we assume that miners’ average cost of electricity was $0.05 per kWh in 2020 and that this cost increases at 1 percent a year in nominal terms. This electricity expenditure is then converted into total electricity consumption.
Box 5: Bitcoin miner cost structure
Bitcoin miners’ costs are predominantly those of their machines and the electricity to run them. Spending on electricity varies as a proportion of their revenue depending on the increasing efficiency of the machines and the volatility of Bitcoin’s price.
We estimate that miners’ electricity costs average approximately 50 percent of their revenues. This is derived from long-run averages at both the network and machine-class level. For the network, we analyzed the proportion of miner revenue spent on electricity over different periods and under different criteria. We also calculated the proportion of revenue spent on electricity for specific machine classes, namely the Antminer S9s and S19s, and took the average proportion over the lifespan of each machine class.
We then validated our results through miner interviews and compared them with external reports from Digiconomist and the Cambridge Centre for Alternative Finance. For comparison, Digiconomist estimates electricity costs at 70 percent of total miner revenue, but we think this is likely an overestimate due to its understating of miners’ expenditure on equipment. Cambridge estimates miner electricity costs at 43 percent of revenue, closer to our estimate.
In July 2021, the electricity costs of Bitcoin miners were very low compared to the long-term average of 50 percent: They spent only around 20 percent of their revenue on electricity. The threefold rise in the Bitcoin price from 2020 increased mining revenue rapidly, but the supply chain takes longer to react with new mining machines and locations. Furthermore, the Chinese crackdown then reduced the number of miners and the associated hashrate. This reduced competition has – via the difficulty protocol – resulted in a lower number of terahashes required to create a new block and a large reduction in electricity demand.
It will take time for the market to return to a new equilibrium level of hash and for miners to increase their electricity consumption to the point at which its cost is 50 percent of their revenues. There is currently a worldwide chip shortage, and there can be significant lead times for setting up new mining locations because of the need for things such as grid connection approvals and transformer purchases.
These logistical factors will slow the recovery in hashrate and therefore boost the profits of existing non-Chinese miners in the interim. This slowdown could potentially continue until the next halving in early 2024, when the reduction in block subsidy will automatically lower mining profitability and, with it, the hashrate. For simplicity, we have modeled a linear return to the long-term average of spending 50 percent of revenue on electricity by 2024, as the market works through the disruption of the Chinese exodus and the threefold increase in price since 2020.
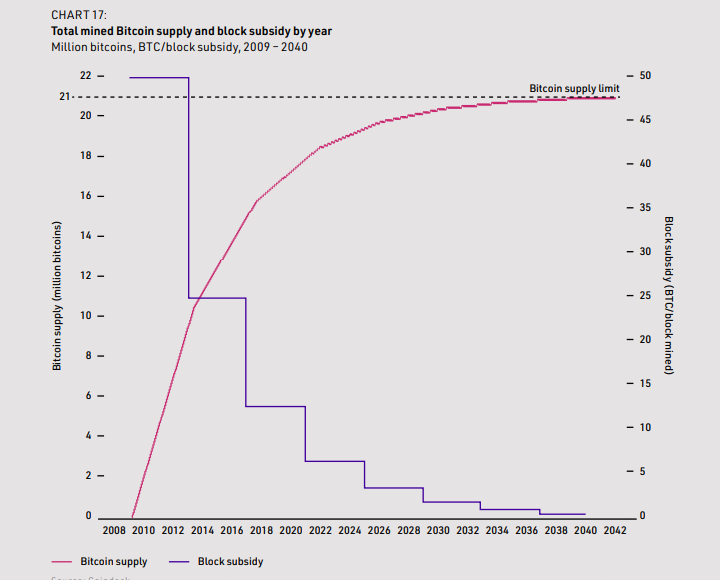
The total revenue pool available to miners consists of two streams: the block subsidy, which consists of newly issued bitcoins; and transaction fees that parties carrying out Bitcoin transactions pay as an incentive to miners to include their transaction in the next block. Of these two parameters, the block subsidy is the most stable and easiest to predict. By design, the reward halves every four years, and it will continue to do so until all 21 million bitcoins have been mined, estimated to be around 2140 (see Appendix 1 and Chart 17).
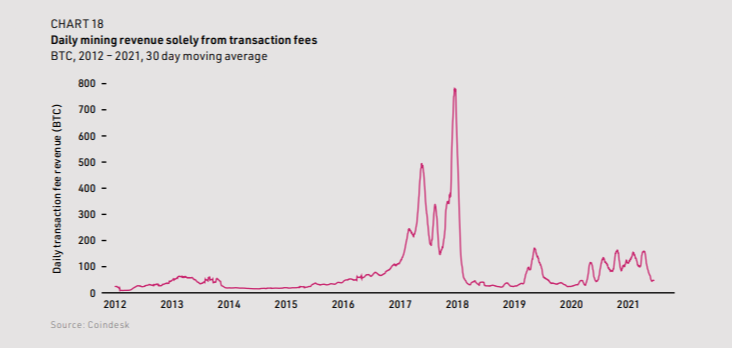
Historically, transaction fees have contributed a much smaller proportion of miner revenue than the block subsidy – an average of roughly 5 percent, or about 60 bitcoins, a day. However, during the first quarter of 2021, average transaction fees increased to around 150 bitcoins a day, and transaction fees have previously exceeded 800 bitcoins a day (see Chart 18). It is uncertain how transaction fees will evolve, as they are driven by the volume of transactions and users’ willingness to pay. For this analysis, we have projected electricity consumption based on an assumption of 150 bitcoins a day.
As transaction fees and block subsidies are themselves denominated in bitcoin, their value to miners is intrinsically linked to the Bitcoin price. This is the most volatile factor in the value of the revenue pool and, therefore, in Bitcoin’s electricity consumption.
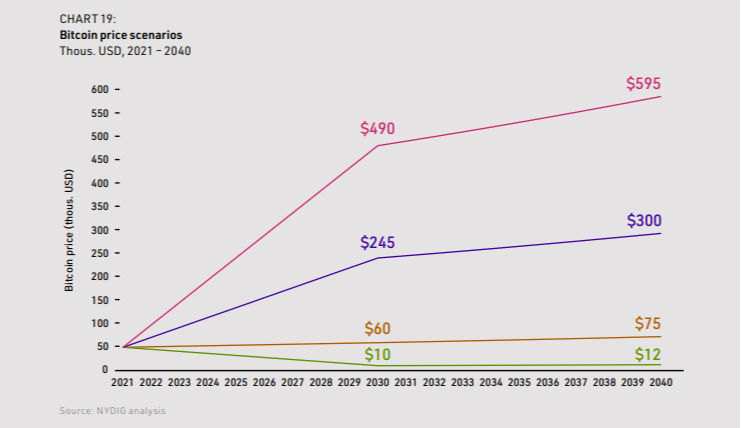
The price of Bitcoin depends exclusively on societal demand, as its supply is fixed by the protocol. It is not the role of this report to predict the future price of Bitcoin, so we have instead projected electricity consumption to 2040 under four price scenarios (see Chart 19). The range of these scenarios is wide, given Bitcoin’s immaturity and high price volatility to date.
- High price: assumes that Bitcoin will equal gold’s historical average value as a store of global wealth. Bitcoin’s market value would rise to a nominal value of $10 trillion in 2030, implying a price of around $490,000 per bitcoin. Between 2030 and 2040, Bitcoin’s price would continue to grow at a slower rate of 2 percent per year, rising to $595,000 in 2040 (see Box 6).
- Medium price: assumes that Bitcoin will equal half the historical average value of gold as a store of global wealth. Bitcoin’s market value would reach a nominal value of $5 trillion in 2030, implying a price of around $245,000 per bitcoin. Between 2030 and 2040, Bitcoin’s price would continue to grow at a slower rate of 2 percent per year, rising to $300,000 in 2040 (see Box 6).
- Base price: assumes the price would grow at a rate of 2 percent per year from the February 2021 average of approximately $50,000, rising to around $60,000 in 2030 and $75,000 in 2040.
- Low price: assumes that the Bitcoin price would decline to $10,000 in 2030, which is in line with the 2020 average. Between 2030 and 2040, Bitcoin’s price would grow at a rate of 2 percent per year, rising to $12,000 in 2040.
After 2030, under all price scenarios, we assume Bitcoin will mature, and its price will stabilize – that is, growth will be slower and volatility will decline.
Box 6: Comparison of Bitcoin to gold - How valuable might Bitcoin become?
Money has taken various forms throughout history – from shells to gold to fiat currencies – and it serves three primary functions: a store of value, a medium of exchange, and a unit of account.
A store of value refers to the ability of money to retain its value over time. For money to act as a strong store of value, there should be a finite supply and some mechanism that restricts the production of new units, to ensure that the value of existing units is maintained. Bitcoin’s supply and production of new units is pre programmed into its protocol. Its supply will increase to a pre-determined limit of 21 million bitcoins, and bitcoins are added to the supply at a fixed rate of one block every 10 minutes – with the number of bitcoins released in each block halving approximately every four years (see Appendix 1.)
Since one of Bitcoin’s primary use cases is as a store of value, and gold is a strong store of value, we have anchored our medium and high price scenarios around estimates for the future value of gold. Since 1910, the value of the world’s gold has averaged around 8 percent of annual global GDP. Global GDP is likely to reach $135 trillion in nominal terms by 2030, implying a nominal value of gold of around $10 trillion. Our high price scenario for Bitcoin assumes that it would equal gold’s value as a store of global wealth and reach a total market value of $10 trillion in 2030. The medium price scenario assumes that Bitcoin would equal half the value of gold as a store of global wealth, reaching a total value of $5 trillion in 2030. Although we have used the value of gold to define our scenarios, there is no reason why Bitcoin cannot become more valuable than gold in the future.
Results
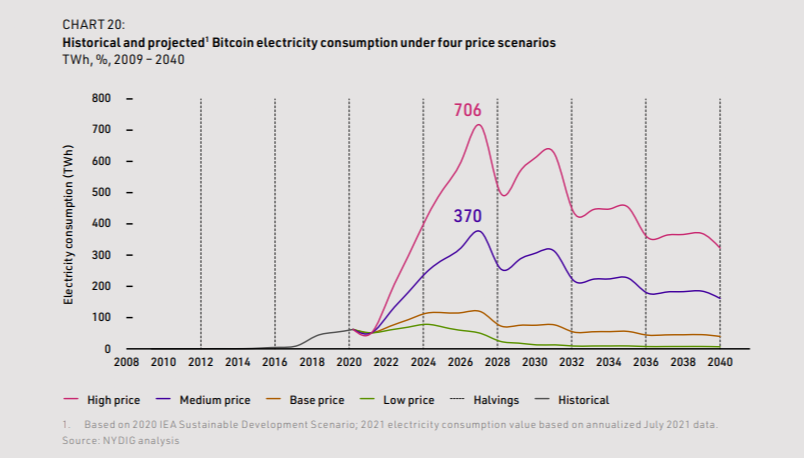
Chart 20 shows projections of Bitcoin’s electricity consumption for each price scenario. Under all price scenarios, Bitcoin’s electricity consumption increases and peaks within the next decade, then declines with each halving of the block subsidy. The halving of the block subsidy causes significant troughs in our projections every four years, as it decreases the revenue pool available to Bitcoin miners, a decline which is not fully offset by either transaction fees or Bitcoin price appreciation.
In the low price scenario, electricity consumption rises to a peak in 2024, as miners relocate and restart their operations following the exodus from China. After this peak, electricity consumption declines rapidly, falling below 2020 levels by 2026. In the base, medium and high price scenarios, electricity consumption rises to a peak in 2027, after which it declines rapidly. Bitcoin’s electricity consumption will increase significantly in the next decade if its price continues to rise: An increase in price would encourage more miners to compete to solve the mathematical problems, resulting in an increase in hashrate and, therefore, electricity consumption. This is shown in the medium and high price scenarios, where electricity consumption peaks at six and 11 times the 2020 level, respectively.
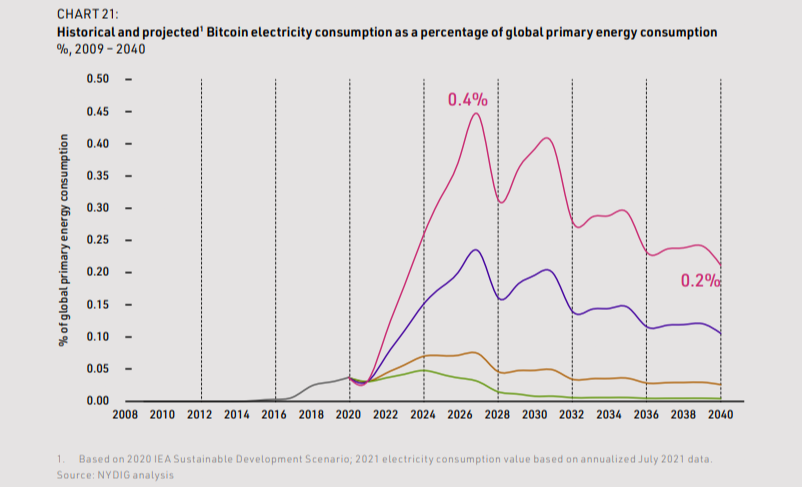
Although Bitcoin’s electricity consumption is projected to increase in the next decade under all price scenarios, it will remain a small proportion of global primary energy consumption and electricity generation (see Chart 21). Even under the high price scenario, where Bitcoin’s electricity consumption peaks at 706 TWh, it will still only account for 0.4 percent of global primary energy consumption and 2 percent of electricity generation. By 2040, its proportion of global primary energy consumption will decrease to 0.2 percent, and its proportion of electricity generation will fall to 0.8 percent (see Chart 21).
3.2 How will Bitcoin’s carbon emissions evolve under these scenarios?
Bitcoin’s future carbon emissions have been estimated using values for the future carbon intensity of grids and a baseline geographic distribution of hashrate. Under all price scenarios, Bitcoin’s carbon emissions increase and peak within the next decade, before declining substantially due to grid decarbonization. Bitcoin’s carbon emissions will always be a small proportion of global emissions: Even at the peak of the high price scenario, Bitcoin’s emissions will only account for 0.9 percent of the global total. Regardless, there is an opportunity for Bitcoin miners to set their carbon emissions on a path to net zero.
Methodology
The Chinese ban on mining has further complicated the assessment of Bitcoin’s future carbon emissions. In the short term, the exodus from China has roughly halved both electricity consumption and annualized carbon emissions, which declined from 49 MtCO₂ in March 2021 to 27 MtCO₂ in July. For at least 12 months and likely longer, it will not be clear which countries will replace China as future mining locations. However, an understanding of locations will be necessary to assess the carbon intensity of future Bitcoin mining.
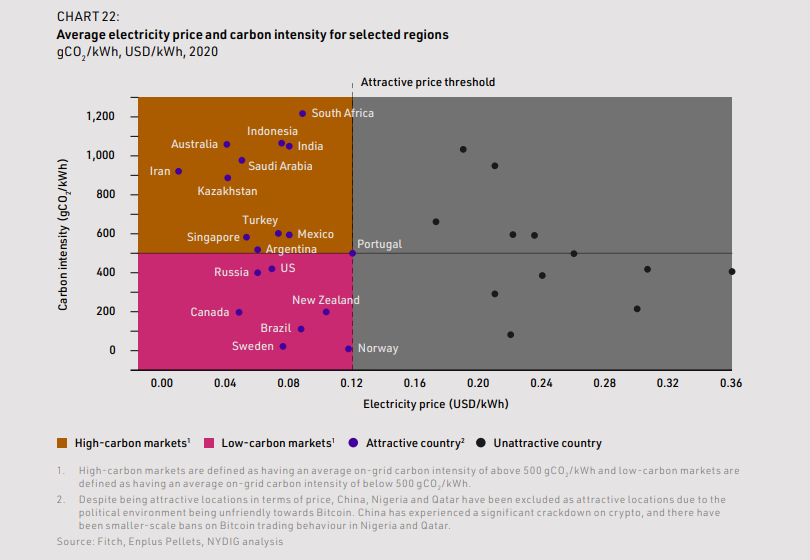
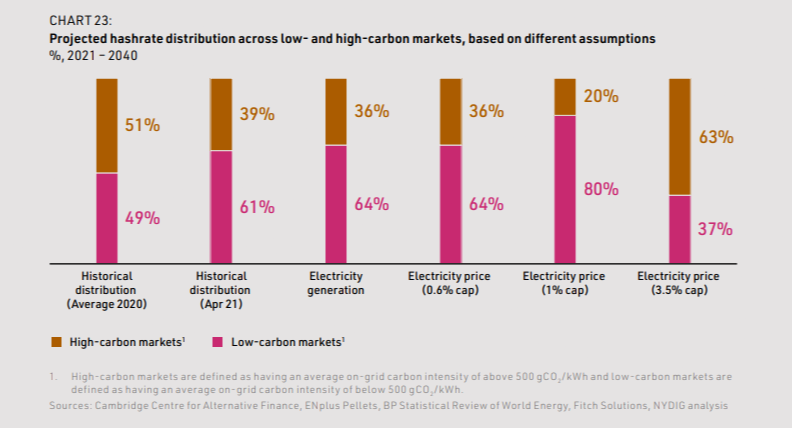
We can expect miners to target those markets where electricity is low in price, new rigs can be connected relatively quickly, and where the political climate is supportive of Bitcoin. Attractive countries for Bitcoin mining are illustrated in Chart 22, and they include both low- and high-carbon-intensity grids. High-carbon markets are defined as those with an average on-grid carbon intensity of above 500 gCO₂/kWh, and low-carbon markets are defined as those with an average on-grid carbon intensity of below 500 gCO₂/kWh. Markets above this threshold are heavily reliant on coal, as natural gas, the next most carbon-intensive fuel, has an average intensity of only around 400gCO₂/kWh.
We categorized these attractive countries as low- or high-carbon markets, based on the average carbon intensity of their grids. We then estimated the likely distribution of mining hashrate between low- and high-carbon markets using three assumptions:
- Historical distribution: We assumed that the historical hashrate in China is redistributed across the other countries where miners were already located.
- Electricity generation: We assumed that the hashrate is distributed across the attractive countries, weighted by each country’s total electricity generation, i.e. the same proportion of a country’s electricity production goes to Bitcoin in each country.
- Electricity price: We assumed that the hashrate is distributed first to the cheapest country until a cap is reached, reflecting the fact that markets do not have unlimited supply of cheap electricity that can be added. This cap is set at a proportion of each country’s total generation (0.6 percent, 1 percent and 3.5 percent), with the maximum based on the highest penetration of miners seen to date, which is in Kazakhstan.
The results of these different assumptions are shown in Chart 23. From this, we estimated a baseline emissions distribution of 60:40 between low- and high-carbon markets, with an upper bound sensitivity of 40:60 and a lower bound sensitivity of 80:20.
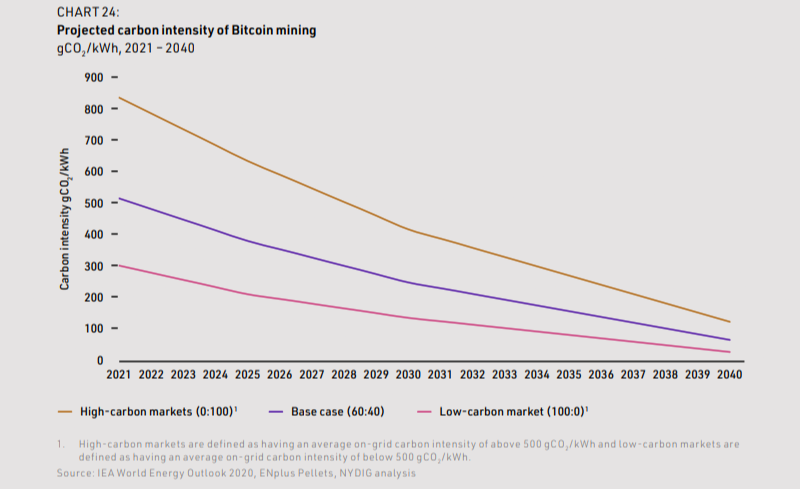
To project the average carbon intensity of each market’s grid, we used the 2020 IEA Sustainable Development Scenario, which provide values for grid carbon intensity at a regional level up to 2040 (see Chart 6). Chart 24 shows the aggregated IEA projections for the low- and high-carbon markets we have defined. Over time, carbon intensity in high-carbon markets falls more rapidly than in low-carbon markets, as low-cost solar and wind displace coal. We assumed that our baseline distribution with a 60:40 split between low- and high-carbon markets remains constant throughout our projections. Regulatory or price developments may shift future distributions, but we have not reflected these possibilities in our projections.
Results
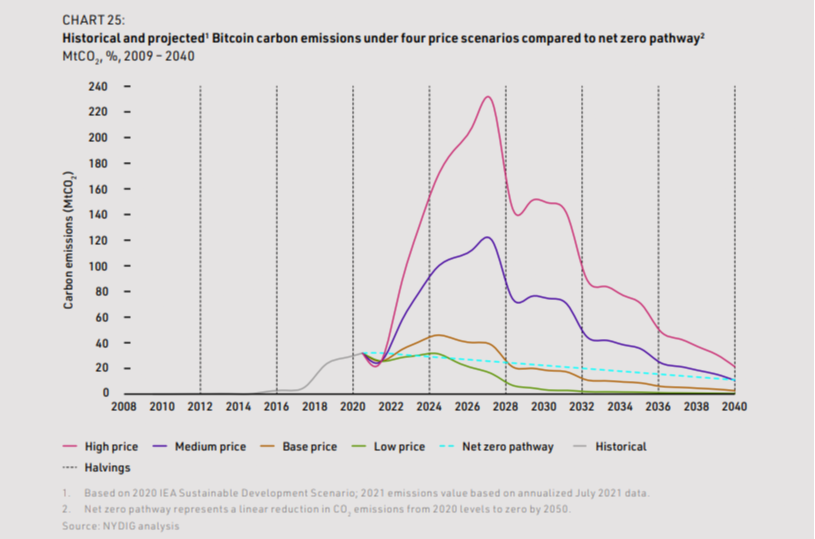
As with electricity consumption, Bitcoin’s carbon emissions increase and peak within the next decade under all price scenarios, before declining substantially (see Chart 25). Due to grid decarbonization, the decline in emissions following the peak is steeper than the decline in electricity consumption shown in Section 3.1.
In the low and base price scenarios, carbon emissions rise to 33 and 47 MtCO₂ in 2024, as electricity consumption increases along with the market’s recovery from the exodus from China. After the 2028 halving of the block subsidy, carbon emissions fall quickly below the net-zero pathway, which represents a linear reduction in carbon emissions from 2020 levels to zero by 2050. In the medium and high price scenarios, carbon emissions rise to a peak in 2027, then decline substantially due to the decarbonization of the grid and the halving. In these scenarios, Bitcoin’s carbon emissions increase significantly before their peaks. In the medium price scenario, emissions reach a peak of 123 MtCO₂ , four times the 2020 level. In the high price scenario, emissions peak at 234 MtCO₂ , seven times the 2020 level.
Even at the peak of the high price scenario, Bitcoin’s emissions will only account for 0.9 percent of global carbon emissions in 2027. By 2040, carbon emissions in the high price scenario will already have returned to pre-2020 levels, at 22 MtCO₂ – just 0.1 percent of global emissions (see Chart 26).
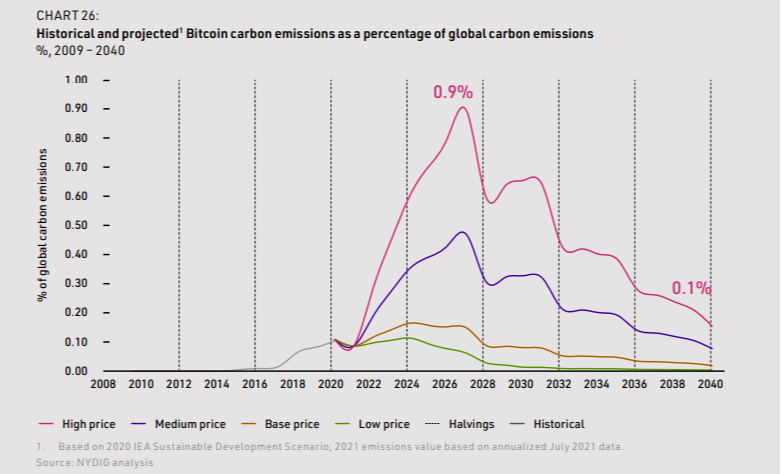
If Bitcoin’s level of adoption and price are low, its emissions will be low. If Bitcoin’s adoption and price are high – because it delivers societal value as a form of sound money – its emissions will be higher, but still small on a global level.
Bitcoin’s future price is the most sensitive parameter for future projections of its associated carbon emissions, which is why we have presented results for four price scenarios. For other parameters, we have tested the sensitivity or our results to our assumptions. Table 3 summarizes our estimates of the input ranges, and the impact of these on our 2030 carbon emissions calculation. These ranges, at less than +/- 30%, are all modest when compared to the price uncertainty.

3.3 What decarbonization levers could reduce emissions?
Bitcoin miners can reduce emissions in the short and medium term by buying carbon offsets, procuring renewable energy, favoring locations with renewable energy, and using wasted energy. Some companies are already leveraging these. In the long term, Bitcoin miners can benefit from grid decarbonization and likely advances in battery storage technology, and the resulting lower storage costs.
There are several decarbonization levers available to Bitcoin miners. To reduce emissions in the short term, they can buy carbon offsets and procure renewable energy from existing sources through the grid. In the medium term, they can favor locations with renewable energy and use wasted energy, such as curtailed hydroelectric energy and flared gas. In the long term, they can benefit from grid decarbonization, as well as likely advances in battery storage technology and lower storage costs, which could solve off-grid renewables’ problem of intermittency (see Chart 27).
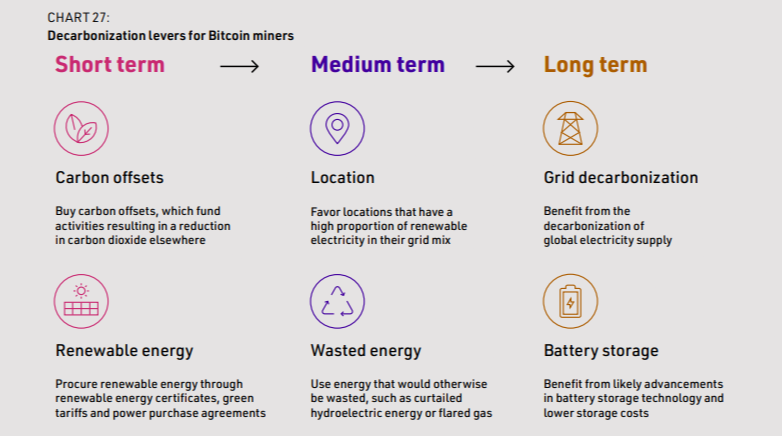
Bitcoin miners are already starting to reduce emissions using these levers, and some companies have recently become carbon neutral. This has predominantly been achieved by locating in regions with a low carbon intensity and by purchasing carbon offsets. As environmental concerns regarding carbon emissions persist, more miners will likely take such actions.
Buy carbon offsets
Bitcoin miners can purchase carbon offsets to neutralize their emissions. A carbon offset for an operation funds an activity that results in a reduction of carbon dioxide elsewhere, such as tree planting or carbon sequestration. As the quality of carbon offsets varies, best practices ensure that offsets fulfill certain conditions:
- Additional: They reduce carbon emissions or remove carbon that would not be reduced through other incentives.
- Permanent: They reduce emissions or remove carbon permanently.
- Without leakage: Gains from a given project do not result in an increase in emissions elsewhere.
- Independently verified: A third party audits the offsets to confirm that the carbon reductions are real and credible.
Box 7: Climate Vault
Several companies provide carbon offsets, including Climate Vault, a non-profit organization founded at the University of Chicago that has a relatively new and innovative solution. Rather than trying to estimate the carbon reductions from planting trees, Climate Vault measures the exact quantity of carbon emissions that an offset prevents. Climate Vault achieves this by purchasing carbon emissions allowances on cap-and-trade compliance markets and vaulting them so that emitters can’t use them.
In a cap-and-trade system, a government sets a cap on the total carbon emissions for a given industry or for the whole economy. Within the cap, regulated entities buy or receive emissions allowances, which they can trade as needed. Each year, regulated entities must surrender enough allowances to cover their carbon emissions; otherwise, they are penalized for violating the system. The compliance market refers to the market through which these regulated entities buy and sell carbon emissions allowances.
By purchasing emissions allowances from the compliance market and not selling them back – thereby “vaulting” them away – Climate Vault decreases the total possible emissions from entities regulated by the cap-and-trade system.
Procure renewable energy
Activities with high electricity consumption, such as certain data centers, can procure electricity that has been generated 100 percent from renewables. This is generally not achievable by relying on the local electricity grid mix. Bitcoin miners can buy such electricity too, in three ways that are simple, effective, and globally recognized.
One way is to buy renewable energy certificates, which prove that a miner has purchased energy generated from renewables (see Section 2.1). These certificates are relatively cheap, averaging at around $1 per megawatt hour, just 2 percent of miners’ average electricity cost of $50 per megawatt hour, and they are available in most countries (see Chart 28). If all Bitcoin miners purchased renewable energy certificates to cover their total demand, it would cost them a total of around $60 million, or about 1 percent of 2020 mining revenues. Leading companies around the world are using renewable energy certificates as a first step to delivering their goal of sourcing 100 percent of their electricity from renewable sources. RE-100, for example, groups leading corporations that are committed to 100 percent renewable energy, and it accepts certificates as a key lever.
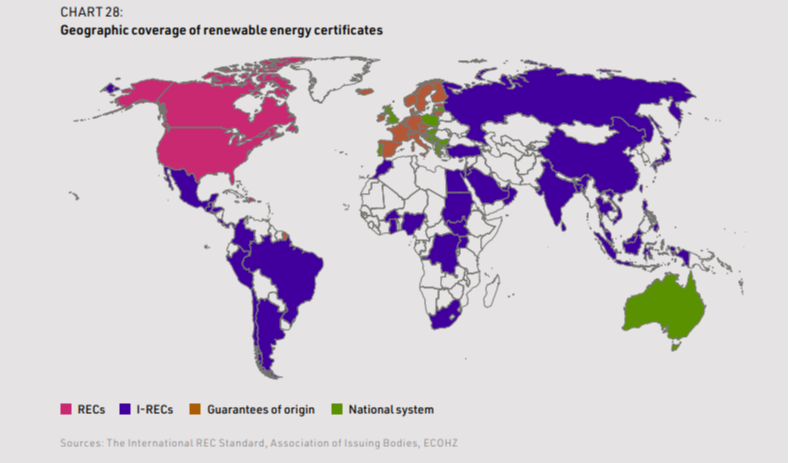
A second option for a Bitcoin miner is to enter a contract with a local electricity supplier that procures renewable energy on their behalf. These contracts usually take the form of “green tariff” programs, in which the electricity supplier procures renewable energy at a small premium to its regular contracts. However, this kind of contract is not available in all countries.
Third, Bitcoin miners can enter short-term (less than five-year) power purchase agreements (PPAs) with renewable energy generators. A PPA details conditions such as the amount of electricity a generator will supply, as well as the price and contract length. These agreements usually involve the purchase of both physical electricity and renewable energy certificates.
Favor locations with renewable energy
Bitcoin can be mined anywhere in the world, provided there is access to a reliable, low-cost supply of electricity and a basic Internet connection. This gives Bitcoin miners, unlike actors in many other industries, the option of favoring locations that have a high proportion of renewable electricity in their grid mix.
The five main factors cited by miners for choosing a mining location are the electricity price, the regulatory environment, infrastructure availability, access to mining machines, and capital costs. Miners can add a sixth factor of access to renewable energy – for example through a high proportion of renewables in the electricity grid mix. The exodus of mining from China provides the industry with an opportunity to deliver a step change in emissions if those miners relocate to low-carbon-intensity regions (see Chart 29).
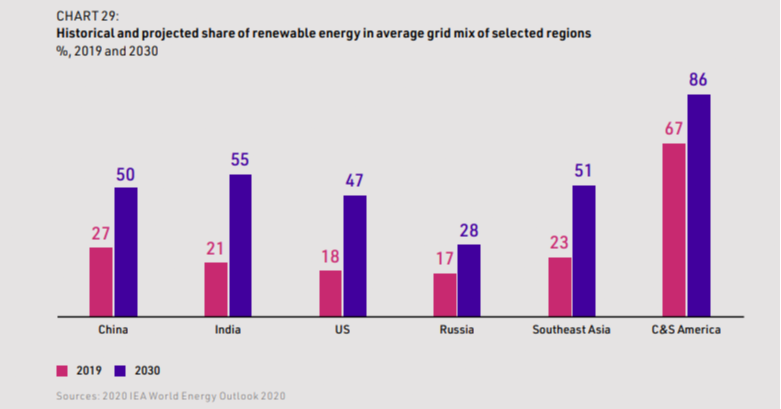
Use waste energy
The use of energy that would otherwise be wasted represents another opportunity to reduce emissions. This waste energy can come in various forms, such as curtailed hydroelectric energy or flared gas.
Curtailed hydroelectric energy
One option is to move to locations with excess hydroelectric energy. China has a significant amount, estimated to be around 30 TWh in 2020. Although miners previously located in China to take advantage of this energy during the wet season, China is not a viable option for the future due to the crackdown on mining. In addition, miners located in China resorted to the use of coal-generated electricity in the dry season (see Boxes 3 and 4).
Bitcoin miners have also started to use Russia’s curtailed hydroelectric energy. One firm, which operates data centers that offer co-location services for cryptocurrency mining, uses surplus hydroelectric energy from the Bratsk region. However, the opportunity is small. Even Russia’s largest hydroelectric power plant, Sayano-Shushenskaya, only curtails up to 2 TWh of its electricity in a year with higher-than-average rainfall. That amounts to just 3 percent of Bitcoin’s electricity consumption in 2020. Evidence of curtailed hydroelectric energy in other markets is also limited, so this opportunity is small in scale.
Shifting to locations with curtailed renewable energy is only effective for hydro energy: Solar and wind curtailment tend to occur for only short periods of time – a few sunny hours in the middle of the day or periods of high wind.
Flared gas
Another possibility is to use gas that would otherwise be flared. Flaring is the controlled burning of gas – mainly methane – given off as a by-product of oil production. Gas is flared when there is no use for it, such as on-site use or outside sale. Flaring is typically carried out in oil fields in remote locations, where export pipelines are limited, and when it is not economical to reinject the gas into the oil reservoir to increase oil production.
Flaring wastes energy and emits carbon dioxide. However, the gas can be converted into electricity using relatively cheap, small-scale turbines on-site, which avoid the need for expensive export pipelines or a grid connection. Bitcoin mining is an ideal use for this electricity because of its flexibility of location. The gas would likely be available at low cost to Bitcoin miners, as it would otherwise be wasted. Projects of this kind have short payback periods and are therefore aligned with Bitcoin mining’s investment horizons of three to five years. Moreover, burning gas in a turbine is much more efficient than burning it through a flare, so more of the methane is burned and less is emitted into the atmosphere. (Methane is a much more potent greenhouse gas than carbon dioxide, with 84 times the warming effect over a 20-year period). One company leveraging this opportunity is Crusoe Energy, which aims by the end of 2021 to utilize up to 0.3 million cubic meters of flared gas a day on Bitcoin mining (see Box 8).
Since this gas would otherwise have been flared, using it to generate electricity to mine Bitcoin represents a productive use of an otherwise wasted energy resource. It results in no incremental increase in greenhouse gas emissions – and possibly a decrease due to a reduction in escaped methane. In 2020, some 142 bcm cubic meters of gas was flared worldwide, sufficient to produce around 430 TWh of electricity. If we exclude offshore and more challenging markets, such as Iraq, there remains around 140 TWh of opportunity.
Due to the geography-independence of Bitcoin mining and the abundant quantities of wasted, curtailed, or inefficiently used energy resources worldwide, miners are increasingly selecting from a wide palette of technologies to procure inexpensive energy, while they are also decarbonizing.
Some miners have adopted a strategy of combining highly renewable sources of energy with offset procurement. For example, one converted a coal plant to a natural gas plant with lower carbon intensity and also committed to offset all its residual emissions. A large US hosting service provider disclosed its energy mix and committed to 100 percent net-carbon-neutral operations through offsets.
Other miners select their locations to procure renewable energy. Some large ones in Ontario and British Columbia use nearly 100 percent hydro power. Lastly, a number of mining firms are already taking advantage of electricity generated from waste gas. We expect these various carbon mitigation strategies, and others, to be increasingly utilized in the coming years.
Box 8: Crusoe Energy gas flaring business model
Crusoe Energy operates 40 gas-powered data centers across the United States and offers hosting services to energyintensive industries. Bitcoin mining represents up to 80 percent of Crusoe’s computing capacity.
Crusoe Energy procures low-cost gas that would otherwise have been flared from oil and gas producers and installing a piping system to transport it to modular 2 MW electricity generators. The electricity is then consumed by Bitcoin mining machines. Crusoe Energy deploys its systems directly to the flare sites, reducing the cost of gas transport and electricity transmission. The company charges Bitcoin miners for their electricity consumption and also mines Bitcoin with its own machines. The company claims that, relative to unmitigated flaring, the use of waste gas for energy reduces carbon equivalent emissions by up to 63 percent as burning the gas in the generators is more efficient at burning the gas and less methane is emitted to the atmosphere.
Conclusion
In this paper, we have estimated the current and historical energy outlays for Bitcoin mining and the resulting carbon emissions. We have also suggested potential future emissions pathways.
The current energy consumption of Bitcoin miners can be inferred relatively easily, but projecting Bitcoin’s future emissions intensity requires various assumptions. These relate to Bitcoin’s price trajectory, miners’ energy mixes and geographies, miners’ economics, the off-grid share of mining activity, the average price of electricity available to miners, and the volume of transaction fees.
However, even in our most aggressive, high price, scenario, in which Bitcoin reaches $10 trillion by 2030, its emissions amount to only 0.9 percent of the world’s total, and its energy outlay is just 0.4 percent of the global total. These figures were calculated without consideration of the observable acceleration in the use of offsets, renewable energy, renewable energy certificates, and waste energy.
Bitcoin mining may also have material ancillary benefits. Because Bitcoin mining represents a highly interruptible load, miners can turn off their machines at short notice during peak times and create slack that other grid consumers can benefit from. As grids come to incorporate more solar and wind power, Bitcoin miners can help smooth out the erratic supply of wind and solar energy. Indeed, miners in certain grids have begun opting into demand-response programs.
Further, given that Bitcoin mining is highly portable and modularizable and functions anywhere on earth due to the ubiquity of satellite Internet, it can help to monetize novel energy assets even before these are fully integrated to the grid. As ‘buyers of first resort,’ Bitcoin miners have the potential to improve the economics of new renewables projects by providing a flexible and immediate offtake.
Overall, the prospects for the decarbonization of Bitcoin mining over the coming decades are quite promising. Meanwhile, against a backdrop of increasing financial surveillance and global monetary instability, the case for Bitcoin as a monetary safe haven and neutral settlement network grows ever stronger.
Appendix 1: Bitcoin 101
What is Bitcoin?
Bitcoin is a cryptocurrency, a form of digital money that exists only in electronic form. Each bitcoin is essentially a computer file stored in a digital wallet on a computer or smartphone.
The concept of Bitcoin was introduced in 2008 in a white paper titled “Bitcoin: A Peer-to-Peer Electronic Cash System” and published under the pseudonym Satoshi Nakamoto. The identity of Nakamoto, and whether Nakamoto is an individual or group of people, is still unknown. The paper detailed how Bitcoin would work (the ‘Bitcoin protocol’), and the first Bitcoin was minted on January 3, 2009. Since its creation, the price of Bitcoin has grown substantially. It crossed the $1 threshold in February 2011 and then reached $1,000 in November 2013 and $10,000 in November 2017. It rose rapidly to a peak of $63,500 in April 2021, before falling back to around $35,000 following China’s crackdown on mining (see Box 4).
Bitcoin was designed eventually to have a finite supply of 21 million bitcoins, so no more than 21 million bitcoins can ever be in circulation. This makes Bitcoin a scarce resource, as it has a limited supply. It is expected that the last bitcoin will be mined in 2140.
How does Bitcoin work?
As Bitcoin is a form of money, it shares several traits with traditional fiat currencies, such as the dollar and the euro. For example, it is a means of exchanging money between two parties and of storing value. However, Bitcoin and fiat currencies have significant differences. Fiat currencies are centralized. They are issued by national governments and rely on intermediaries – notably banks and payment processors such as Paypal and Visa – to record and verify transactions between two parties.
In contrast, Bitcoin is a decentralized currency. Bitcoins are not issued by a single entity, and Bitcoin does not rely on intermediaries to record and verify transactions. Instead, the issuance mechanism is built into the Bitcoin protocol, and Bitcoin transactions are recorded and verified on a public, distributed ledger known as a blockchain. The blockchain is installed on thousands of individual participants’ computers around the world, known as ‘nodes’, ensuring that no individual or company can control it. The blockchain is composed of a chain of blocks, where a block refers to a set of Bitcoin transactions from a given period.
The Bitcoin network has no central authority, like a bank, to add new blocks to the blockchain and verify transactions to ensure there is no ‘double-spending’ – that is, to ensure that a holder of bitcoins does not use them to pay for more than one transaction. Instead, all transactions are recorded and verified through the ‘proof of work’ mechanism. This gives participants that solve complex mathematical problems the right to add the next block of transactions to the blockchain. Solving the problems typically requires a large investment of computational resources – and, consequently, electricity. These competing participants are called ‘miners’ or ‘mining nodes,’ because the process of adding new blocks to the blockchain is known as Bitcoin mining. They mostly use specialized, high-end computers. While successful mining nodes add blocks to the blockchain, other non-mining nodes verify that the added blocks are valid and in line with the Bitcoin protocol. These non-mining nodes are much less resource-intensive.
The complex mathematical problems are only possible to solve by trial and error. The number that the miners are solving for is called the ‘nonce,’ and each attempt to guess the number is known as a ‘hash.’ Every hash has the same probability of delivering the correct solution – similar to a lottery. The fastest miner to solve the problem adds a new block of verified transactions to the blockchain. Unconfirmed transactions wait in the Bitcoin ‘memory pool’, or ‘mempool’ for short, which is essentially a waiting room. After confirmation, the transactions form part of a block.
The Bitcoin protocol is set with a target of mining a new block once every 10 minutes, on average. If the number of miners competing to solve the mathematical problems increases, then the ‘hashrate’ (the total number of calculations per unit time) increases, and the time to mine blocks will decrease. Similarly, if the number of miners decrease, the hashrate decreases, and the mathematical problem will take longer to solve. Therefore, to maintain a target block time of 10 minutes, the Bitcoin protocol is programmed to self-adjust the difficulty level of the mathematical problems approximately every two weeks. This is known as the ‘difficulty adjustment’. This is a critical factor driving electricity consumption, as the harder the difficulty protocol the more electricity is required to support the Bitcoin network.
Bitcoin miners are awarded bitcoins in reward for their work in creating a new block of verified transactions. This block reward comes in two forms: firstly, through a ‘block subsidy’, which consists of newly issued bitcoins; and secondly, through ‘transaction fees,’ which are paid by parties carrying out Bitcoin transactions to incentivize miners to include their transaction in the next block. The block subsidy is pre-determined by the Bitcoin protocol. It started at 50 bitcoins (BTC) and halves every 210,000 blocks (approximately every four years), a process that will continue until all 21 million bitcoins have been mined. This process is known as ‘halving’. Bitcoin’s block subsidy has halved three times since Bitcoin came into existence – to 25 BTC in 2012, 12.5 BTC in 2016, and 6.25 BTC in 2020. The next halving will occur in 2024. The transaction fees vary and depend on transaction size and on how much the network is crowded with transactions: Fees rise during high-volume periods. Transactions with a higher fee are more likely to be included in the next block.
The proof-of-work model adds a real-world cost to new ledger entries. These are supposed to consist of a single, linear history of verified transactions on the blockchain that users can trust will not be reversed. This is known as the ‘canonical’ transaction history. If a miner misbehaves – either by producing invalid blocks or by creating branching, alternative chains that do not build atop the canonical history – that miner is punished through a loss of the block reward. But miners work hard to earn this reward. They use specialized, high-end computers, the value of which derives from the block rewards earned over their useful lifetime. Miners therefore have an extremely strong economic motive to be honest and construct a single, linear history of verified transactions on the blockchain that users can trust will not be reversed. Thus, the economic cost attached to blocks (expressed in the form of electricity and computational resources spend) keeps the miners in check.
As such, the proof-of-work mechanism built into the process of mining acts to verify Bitcoin transactions and issue new bitcoins. No single entity coordinates these miners. Instead, the Bitcoin protocol – in particular the economic incentives established by proof of work – keeps the system running. It gives users confidence that their transactions will be added to the blockchain and that the blockchain will ultimately converge to a single, final, linear transactional history.
Appendix 2: Crypto Adoption Index and other key socioeconomic indicators 2021

Endnotes
- http://www.ipsnews.net/2002/06/argentina-small-savers-are-the-big-losers/
- According to the Argentine economist Bernando Kliksberg – see https://core.ac.uk /download/pdf/73534.pdf
- In the 2020 Statista index of per capita cr yptocurrency adoption, Argentina places ninth, with 14.
- percent of respondents indicating owning cr yptocurrency: https://www.statista.com/statistics/1202468/global-cr yptocurrency-ownership/ 4 https://www.coindesk.com/argentinas-ripio-acquires-second-largest-cr ypto-exchange-in-brazil
- https://www.nytimes.com/2018/05/23/world/asia/turkey-lira-erdogan.html
- https://www.theguardian.com/world/2018/aug/13/how-serious-is-turkeys-lira-crisis-and-what-are-the-implications
- https://www.dailysabah.com/business/finance/collapses-of-exchanges-vs-turkish-cr ypto-boom
- https://www.theguardian.com/world/2021/mar/21/turkish-lira-could-plunge-15-as-erdogan-faces-market-wrath-forsacking-bank-chief
- Some data points here: https://www.economist.com/middle-east-and-africa/2019/10/05/a-long-feared-currency-crisishas-begun-to-bite-in-lebanon
- https://www.ft.com/content/df234c78-a945-4199-befe-0272259dc755
- https://www.npr.org/2021/07/12/1015337240/the-economic-crisis-in-lebanon-may-be-one-of-the-worst-in-the-worldsince-the-18
- https://www.nbcnews.com/news/world/there-no-future-here-lebanese-struggle-through-economic-collapse-n1273741
- https://www.worldbank.org/en/countr y/lebanon/publication/lebanon-economic-monitor-spring-2021-lebanon-sinking-tothe-top-3
- https://www.nbcnews.com/news/world/there-no-future-here-lebanese-struggle-through-economic-collapse-n1273741
- https://www.coindesk.com/how-bitcoin-fits-into-lebanons-banking-crisis
- https://blogs.l se.ac.uk /latamcaribbean/2021/02/10/day-zero-how-and-why-cuba-unified-its-dual-currency-system/
- https://www.reuters.com/world/americas/explainer-how-cubas-monetar y-reform-will-take-place-impacteconomy-2020-12-11/
- https://www.reuters.com/ar ticle/us-cuba-economy-analysis/analysis-cubas-looming-monetar y-reform-sparks-confusioninflation-fears-idUSKBN29418I
- https://www.reuters.com/world/americas/roaring-inflation-compounds-cubans-economic-woes-2021-06-16/
- https://www.reuters.com/world/africa/nigerias-annual-inflation-hit-more-than-4-year-high-march-2021-04-15/
- https://www.statista.com/statistics/383132/inflation-rate-in-nigeria/
- https://www.bloomberg.com/news/ar ticles/2021-05-25/nigeria-devalues-naira-on-migration-to-single-exchange-rate
- https://dlocal.com/blog/markets-consumers/central-bank-of-nigeria-introduces-currency-control s-and-spending-limits/
- https://www.statista.com/char t/18345/cr ypto-currency-adoption/
- https://www.coindesk.com/cr ypto-booming-in-nigeria-despite-banking-ban
- https://www.theguardian.com/technology/2021/jul/31/out-of-control-and-rising-why-bitcoin-has-nigerias-governmentin-a-panic
- Hanke and Krus table
- https://qz.com/1096237/deutsche-bank-analysis-on-the-frequency-of-financial-crises/
- https://www.frbsf.org/economic-research/files/wp11-22bk.pdf
- Reuters 27/06/2017 https://www.reuters.com/ar ticle/us-usa-fed-yellen-idUSKBN19I2I5
- https://www.ft.com/content/664c575b-0f54-44e5-ab78-2fd30ef213cb
- https://www.bloomberg.com/news/newsletters/2021-07-09/what-s-happening-in-the-world-economy-the-centralbankers-of-everything
- https://www.spglobal.com/ratings/en/research/ar ticles/210412-default-transition-and-recover y-2020-annual-sovereigndefault-and-rating-transition-study-11888070 #:~:text=From percent202010 percent20to percent202020 percent2C percent20sovereign,per percent20year percent20in percent201999 percent2D2009
- HRF
- This is equivalent to 16 percent of all the gold held for investment purposes, assuming 74,000 metric tons of gold held in bullion, by central banks, or used to back exchange-traded products, or six times all the silver held by investors
- CM data
- https://www.jbs.cam.ac.uk /faculty-research/centres/alternative-finance/publications/3rd-global-cr yptoassetbenchmarking-study/
- https://www.coinbase.com/about
- https://www.newsweek.com/46-million-americans-now-own-bitcoin-cr ypto-goes-mainstream-1590639
- https://assets.ctfassets.net/hfgyig42jimx/5u8QqK4lqjEgL 506mOx4m3/d44d8e204aecfc75a839e2a9d505f5d1/Cr ypto.com _ Data_Report_-_On-chain_Market_Sizing.pdf
- Source: Chainalysis Global Crypto Adoption Index
- See Hasu and Su Zhu (https://medium.com/@hasufly/bitcoin-and-the-promise-of-independent-proper ty-rights8f10e5c7efa8) and Ark Invest (https://ark-invest.com/white-papers/bitcoin-par t-one/)
- For a formal version of the argument see Yermack, Raskin, and Saleh https://papers.ssrn.com/sol3/papers.cfm?abstract _ id=3437529
- https://data.worldbank.org/indicator/EG.ELC.ACCS.ZS
- https://www.iea.org/news/air-conditioning-use-emerges-as-one-of-the-key-drivers-of-global-electricity-demand-growth
- Source: IEA World Energy Outlook 2020
- Source: World Bank
- Source: IE A 2018 Energy Balances for World
- Source: IEA World Energy Outlook 2020
- Cambridge Bitcoin Electricity Consumption Index (CBECI) Mining Equipment List
- Certain machine classes (namely Antminer S7s and S9s) leave a signature within the nonce data of ever y block they mine. By analysing the nonce data of ever y mined block, it is possible to estimate the propor tion of blocks mined by these machine classes, and by extension their share of hashrate
- Source: sur vey of mining location conducted by the Cambridge Centre for Alternative Finance. This dataset aggregates data from mining pools representing 32-37 percent of Bitcoin’s total hashrate for the period January to December 2020
- This includes mining, milling, smelting, and refining gold and includes indirect electricity emissions
- Caps tested were 0.6 percent (lower bound ensuring spread across all attractive countries), 1 percent (average propor tion currently obser ved from Cambridge Centre for Alternative Finance data) and 3.5 percent (max propor tion currently obser ved from Cambridge data, which is in Kazakhstan)
- Source: National Energy Administration of China
- Source: BitRiver
- Source: Hydropower of Russia Association
- Source: IPCC A ssessment Repor t 5, Working Group 1, Chapter 8: Anthropogenic and Natural Radiative Forcing
DISCLOSURES
This report has been prepared solely for informational purposes and does not represent investment advice or provide an opinion regarding the fairness of any transaction to any and all parties nor does it constitute an offer, solicitation or a recommendation to buy or sell any particular security or instrument or to adopt any investment strategy. Charts and graphs provided herein are for illustrative purposes only. This report does not represent valuation judgments with respect to any financial instrument, issuer, security or sector that may be described or referenced herein and does not represent a formal or official view of New York Digital Investment Group or its affiliates (“NYDIG”).
It should not be assumed that NYDIG will make investment recommendations in the future that are consistent with the views expressed herein, or use any or all of the techniques or methods of analysis described herein in managing client accounts. NYDIG may have positions (long or short) or engage in securities transactions that are not consistent with the information and views expressed in this report.
There can be no assurance that any investment strategy or technique will be successful. Historic market trends are not reliable indicators of actual future market behavior or future performance of any particular investment, which may differ materially, and should not be relied upon as such. Target or recommended allocations contained herein are subject to change. There is no assurance that such allocations will produce the desired results. The investment strategies, techniques or philosophies discussed herein may be unsuitable for investors depending on their specific investment objectives and financial situation.
The information provided herein is valid only for the purpose stated herein and as of the date hereof (or such other date as may be indicated herein) and no undertaking has been made to update the information, which may be superseded by subsequent market events or for other reasons. The information in this report may contain forward-looking statements regarding future events, targets, or expectations regarding the strategies, techniques or investment philosophies described herein. NYDIG neither assumes any duty to nor undertakes to update any forward-looking statements. There is no assurance that any forward-looking events or targets will be achieved, and actual outcomes may be significantly different from those shown herein. The information in this report, including state-ments concerning financial market trends, is based on current market conditions, which will fluctuate and may be superseded by subsequent market events or for other reasons.
Information furnished by others, upon which all or portions of this report are based, are from sources believed to be reliable. However, NYDIG makes no represen-tation as to the accuracy, adequacy or completeness of such information and has accepted the information without further verification. No warranty is given as to the accuracy, adequacy or completeness of such information. No responsibility is taken for changes in market conditions or laws or regulations and no obligation is assumed to revise this report to reflect changes, events or conditions that occur subsequent to the date hereof.
Nothing contained herein constitutes investment, legal, tax or other advice nor is it to be relied on in making an investment or other decision. Legal advice can only be provided by legal counsel. Before deciding to proceed with any investment, investors should review all relevant investment considerations and consult with their own advisors. Any decision to invest should be made solely in reliance upon the definitive offering documents for the investment. NYDIG shall have no liability to any third party in respect of this report or any actions taken or decisions made as a consequence of the information set forth herein. By accepting this report in its entirety, the recipient acknowledges its understanding and acceptance of the foregoing terms.
